

 menu
|
|
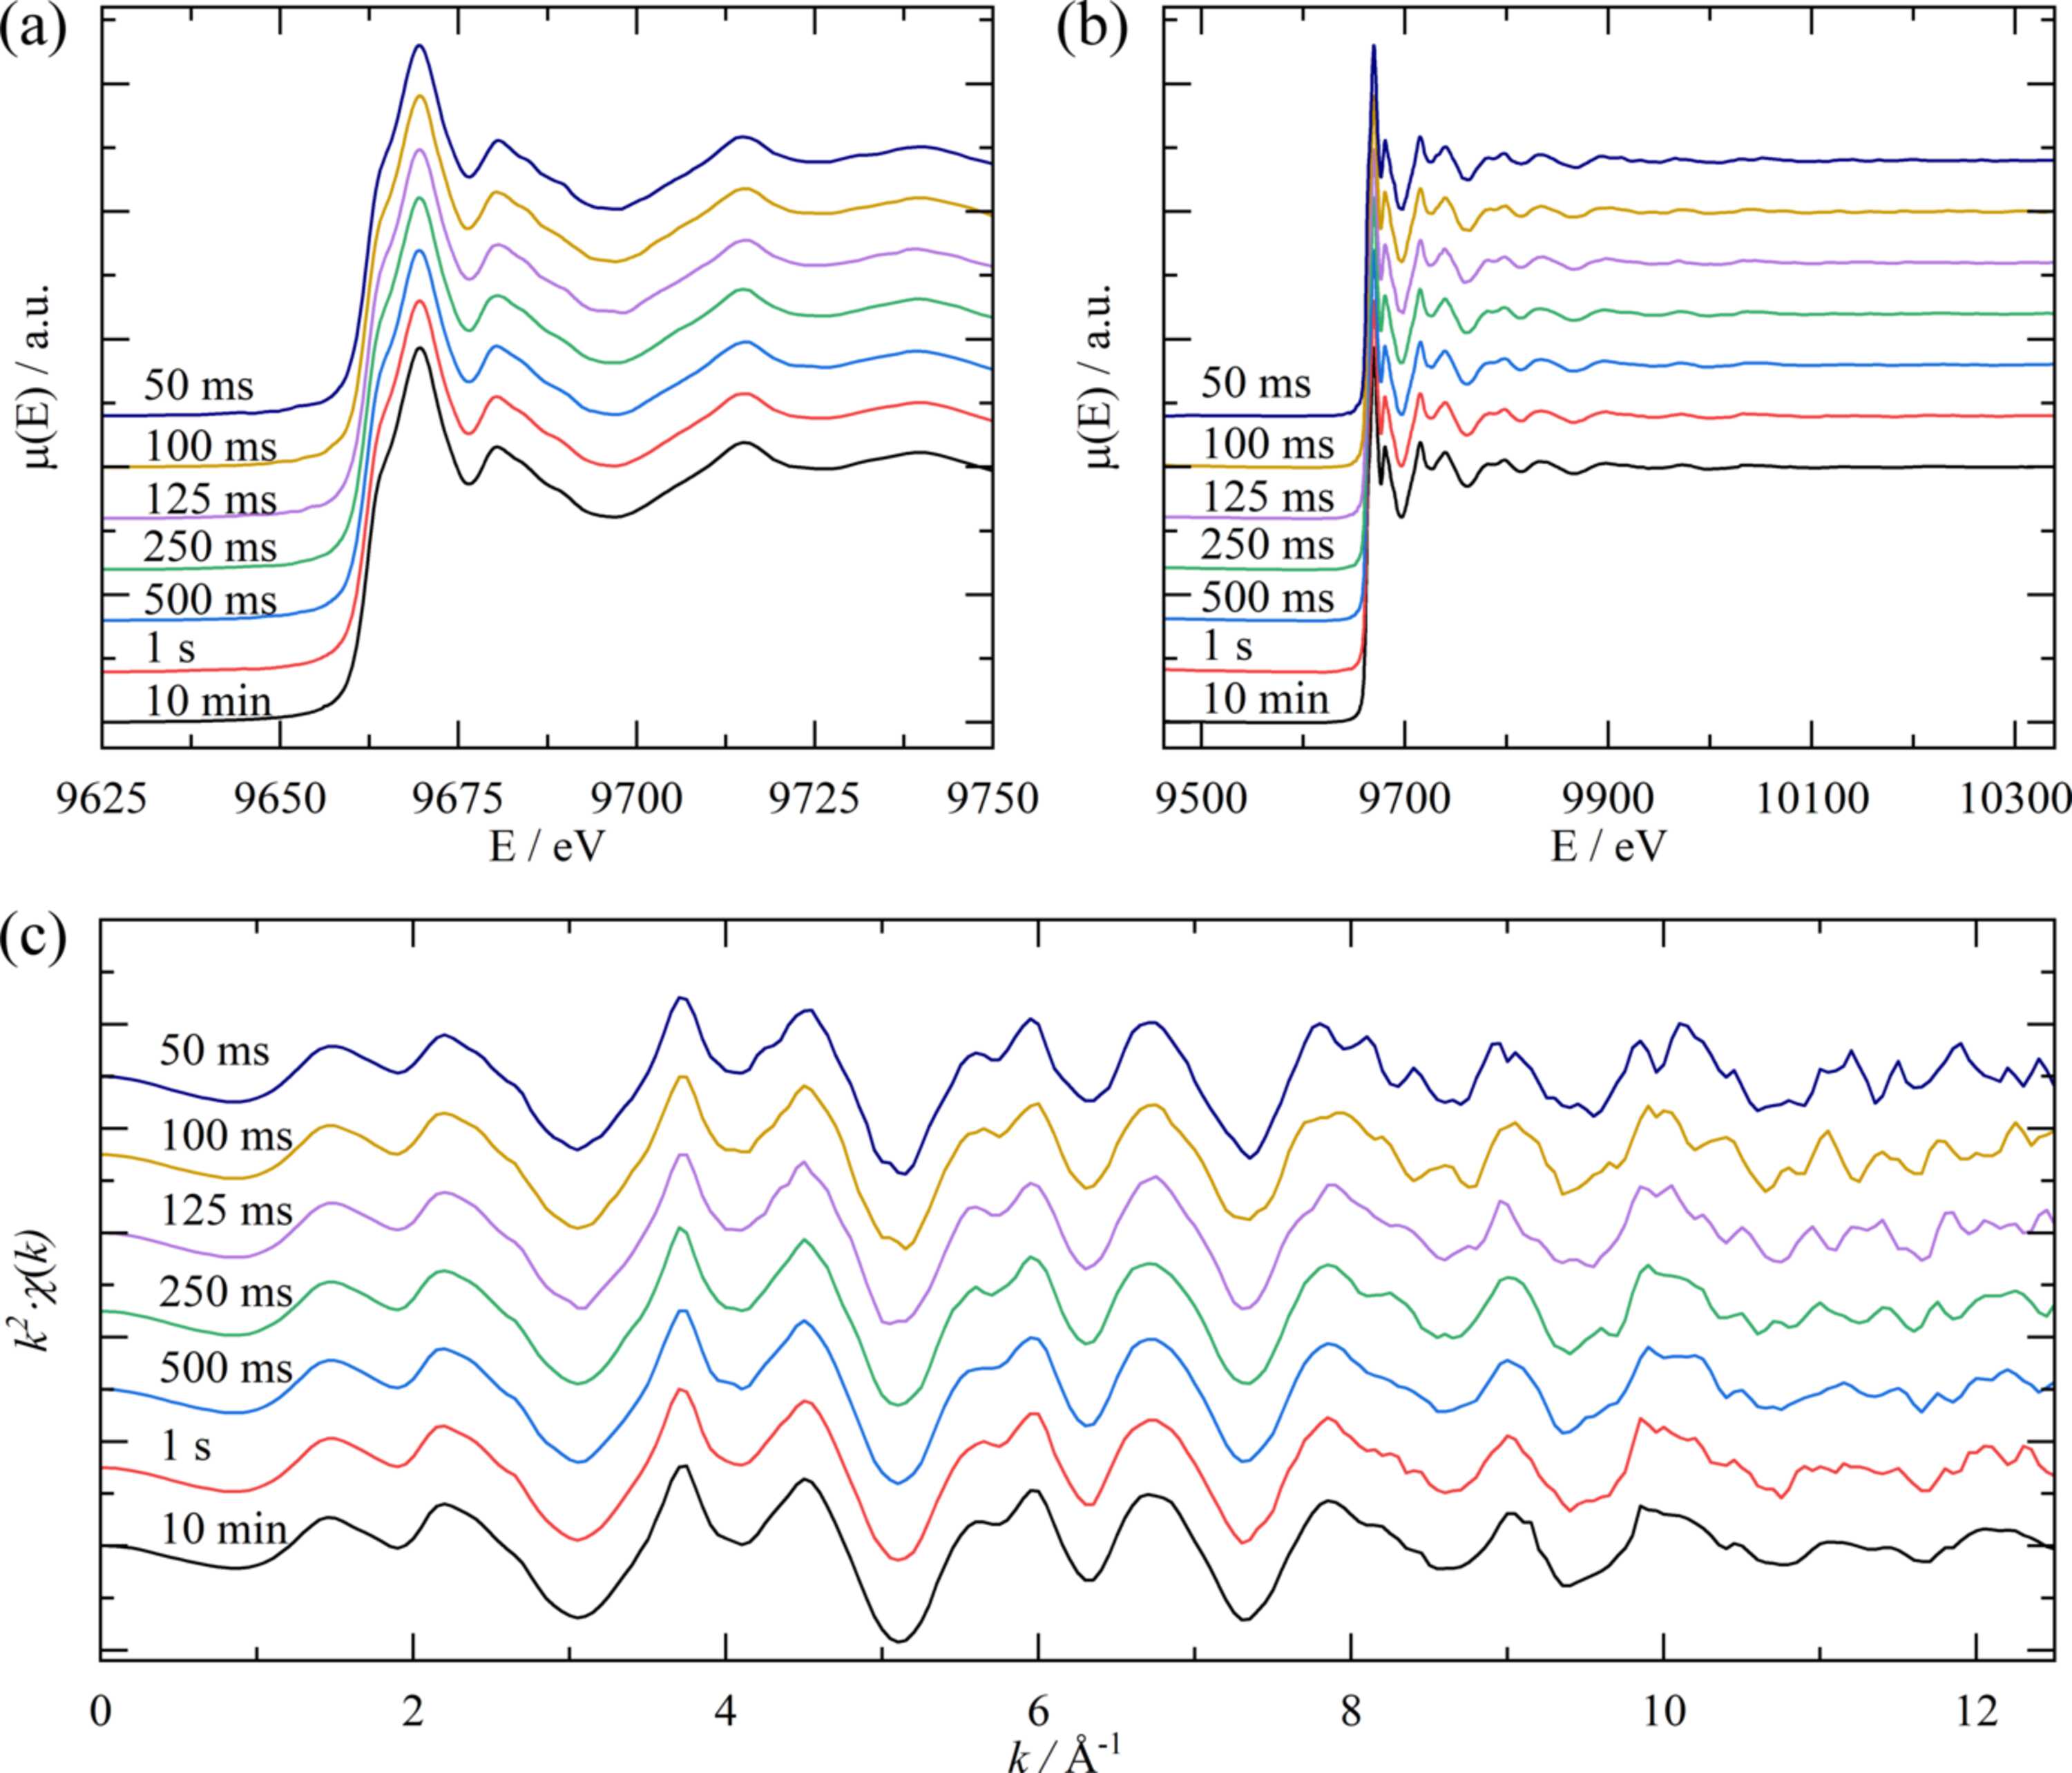
Figure 7
Normalized Zn K-edge (a) XANES and (b) full XAFS spectra of 1 wt% ZnO acquired with different scan times. (c) Comparison of the corresponding k2-weighted EXAFS oscillations. A conventional step-scan XAFS spectrum (10 min) is presented for comparison. All measurements were performed in fluorescence mode. |
 | JOURNAL OF SYNCHROTRON RADIATION |
ISSN: 1600-5775
 access