

 menu
|
|
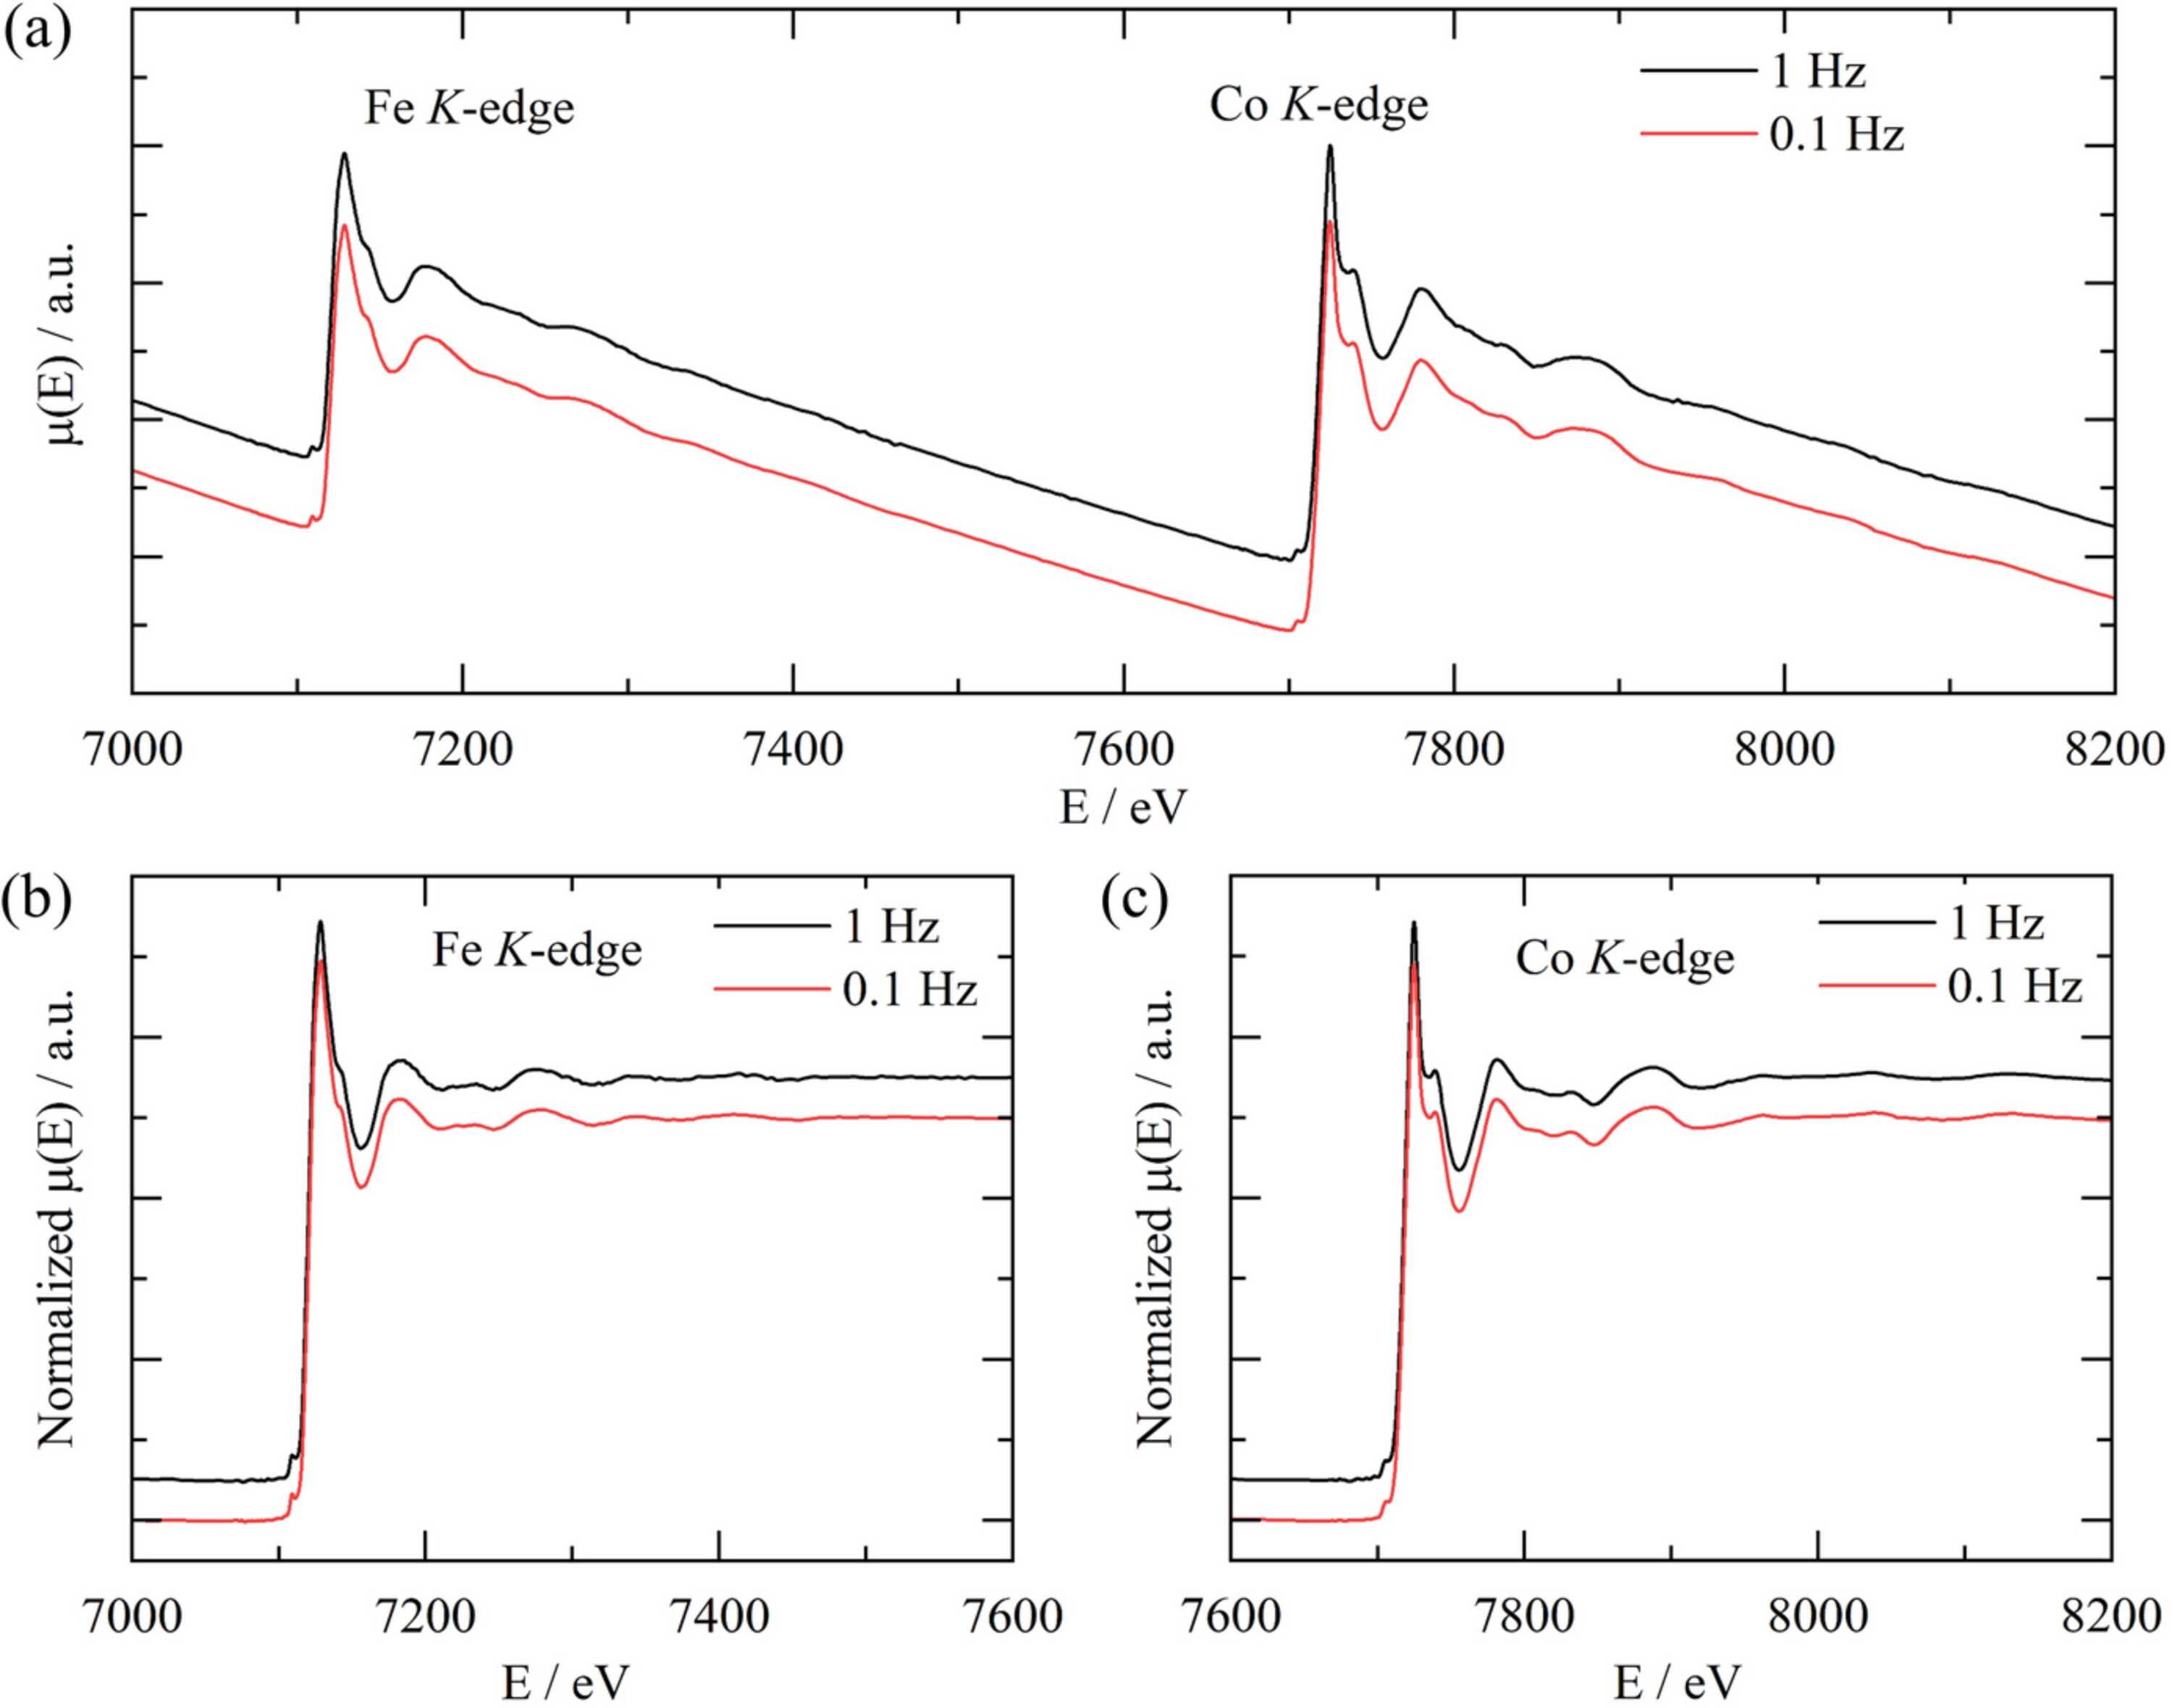
Figure 8
(a) Wide-range QXAFS spectra of Co0.6Fe0.4MoO4 covering both the Fe and Co K-edges in a single scan. Normalized K-edge XAFS spectra of (b) Fe and (c) Co extracted from the continuous scans. All measurements were performed at monochromator oscillation frequencies of 0.1 and 1 Hz. The spectra are vertically offset for clarity. |
 | JOURNAL OF SYNCHROTRON RADIATION |
ISSN: 1600-5775
 access