

 menu


short communications
 | JOURNAL OF SYNCHROTRON RADIATION |
 access
Extending high-resolution ptychography into the tender X-ray regime at NanoTerasu BL10U

aInternational Center for Synchrotron Radiation Innovation Smart (SRIS), Tohoku University, 468-1 Aramaki-Aza-Aoba, Aoba-ku, Sendai, Miyagi 980-8572, Japan, bDepartment of Metallurgy, Graduate School of Engineering, Tohoku University, 6-6-2 Aoba-yama, Aoba-ku, Sendai 980-8579, Japan, cRIKEN SPring-8 Center, 1-1-1 Kouto, Sayo-cho, Sayo-gun, Hyogo 679-5148, Japan, dInstitute of Multidisciplinary Research for Advanced Materials (IMRAM), Tohoku University, 2-1-1 Katahira, Aoba-ku, Sendai 980-8577, Japan, and eInstitute for Materials Research, Tohoku University, 2-1-1 Katahira, Aoba-ku, Sendai 980-8577, Japan
*Correspondence e-mail: [email protected], [email protected]
X-ray ptychography is a lensless imaging method in which spatial resolution is determined by both the highest spatial frequency in diffraction intensity patterns and sample scanning precision. Tender X-rays (2–5 keV) provide a useful balance of strong phase and absorption contrast, and access to elemental absorption edges. However, high-resolution imaging in this energy range remains challenging because of limited access to high-brightness sources, high-performance monochromators, and sufficiently sensitive detectors. The radiation dose also becomes an important consideration at high resolution. In this study, we extended the spatial-resolution capability of tender X-ray ptychography at 4.5 keV. Experiments were conducted at the BL10U beamline of NanoTerasu, a 3 GeV synchrotron radiation facility, using advanced Kirkpatrick–Baez focusing mirrors and a CITIUS detector. Diffraction patterns collected at multiple detector positions were jointly used for image reconstruction to increase the accessible spatial-frequency range. Edge-response analysis of the reconstructed phase projection of Au-nanocubes yielded a projection spatial resolution of approximately 7.4 nm. These results demonstrate high-resolution imaging in the tender X-ray region and expand the spatial-resolution capability of the NanoTerasu BL10U ptychography system.
Keywords: tender X-ray ptychography; advanced Kirkpatrick–Baez focusing mirror; CITIUS detector; high-resolution X-ray imaging; NanoTerasu.
1. Introduction
Coherent X-ray diffraction imaging (CXDI) is a lensless imaging technique that reconstructs sample images from far-field diffraction intensity patterns generated by coherent X-ray illumination (Chapman & Nugent, 2010 ; Miao, 2025). X-ray ptychography is a scanning CXDI method in which overlapping illuminated regions and phase-retrieval calculations enable simultaneous reconstruction of the projected sample image and the incident wavefield (Rodenburg et al., 2007; Pfeiffer, 2018). The achievable spatial resolution depends on the maximum spatial frequency recorded in the diffraction patterns and the sample scanning precision. Selecting an appropriate photon energy allows enhanced phase or absorption contrast (Górecki et al., 2023) and chemical-state imaging based on resonant dispersion (Giewekemeyer et al., 2011; Hirose et al., 2019; Hitchcock et al., 2024; Kulow et al., 2024; Takeo et al., 2026). Flexible photon-energy control is therefore essential for imaging diverse samples (Da Silva et al., 2019; Schropp et al., 2020; Johansson et al., 2021; Xu et al., 2024).
Advances in ptychographic systems have enabled single-digit-nanometre full-period resolution in two-dimensional imaging in both the soft X-ray region (<2 keV) (Shapiro et al., 2014; Butcher et al., 2025) and the hard X-ray region (>5 keV) (Deng et al., 2019). Furthermore, three-dimensional hard X-ray ptychographic imaging has achieved a half-pitch resolution of 4.2 nm, corresponding to a full-period scale of 8.4 nm (Aidukas et al., 2024). In contrast, high-resolution ptychography in the tender X-ray regime (2–5 keV) has been limited by source flux, monochromator performance, and detector efficiency (Abe et al., 2021). Among these, the source flux is one of the most fundamental factors for high resolution because a high flux can help compensate for photon losses in the monochromator and detector. Another limitation is the high radiation dose required to record weak high-spatial-frequency signals. The tender X-ray regime combines stronger sample interactions than hard X-rays with greater penetration than soft X-rays, enabling high-contrast imaging at practical sample thicknesses. Improving spatial resolution in this regime would broaden the applicability of tender X-ray ptychography for nanoscale structural and chemical analysis.
In previous work, we developed a broadband ptychographic system spanning the tender-to-hard X-ray range at BL10U of NanoTerasu, a 3 GeV synchrotron radiation facility, using advanced Kirkpatrick–Baez (AKB) mirrors and the high-speed CITIUS detector (Sasaki et al., 2026a). That study achieved imaging and spectromicroscopy with spatial resolutions better than 50 nm at multiple photon energies. Here, we extend the spatial-resolution capability of this system in the tender X-ray region at 4.5 keV under operation of the NanoTerasu storage ring at its maximum current. Au nanocubes with sharp edge structures served as the test sample. Diffraction patterns were collected at multiple detector positions to expand the measurable spatial-frequency range, and spatial resolution was evaluated from edge structures in the reconstructed image. The results demonstrate substantially improved resolution in the tender X-ray region and establish a foundation for further high-resolution ptychography at lower photon energies.
2. Experimental methods
Ptychographic measurements were performed using the AKB mirror focusing optics at the BL10U beamline of NanoTerasu. Fig. 1 presents a schematic of the system. During operation, the storage-ring current was 400 mA, corresponding to the maximum operating value. Synchrotron radiation from an in-vacuum undulator was tuned to 4.5 keV using a Si(111) double-crystal monochromator (Okui et al., 2026). The downstream transport channel (TC) slits were set to 10 µm (horizontal) × 50 µm (vertical). The emerging beam was focused by the AKB mirrors (Matsuyama et al., 2017), which also suppressed higher-order harmonics. Their critical energy is approximately 10 keV, determined by the Si material of the reflecting surface and a grazing-incidence angle of ∼3 mrad (Tiwari et al., 2002; Hirose et al., 2020a). The sample was positioned at the focal point, and diffraction intensity patterns were recorded using a CITIUS 840k detector located roughly 1.87 m downstream of the sample.
 | Figure 1 Optical layout for X-ray ptychography at NanoTerasu BL10U. |
The AKB focusing mirrors were aligned by adjusting the mirror angles and the distance between the mirrors and the sample. The focusing beam was evaluated by ptychographic measurements of a 100 nm-thick Ta test chart (XRESO-20, NTT Advanced Technology Corp.), using its known structures to verify the imaging performance after alignment. The sample was raster scanned over a 17 × 17 grid with a 300 nm step and a 5 s exposure per point. The incident X-ray at the sample plane was approximately 2.95 × 10⁹ photons s−1. The wavefield and sample image were reconstructed using a three-mode mixed-state extended ptychographic iterative engine (ePIE) algorithm with X-ray illumination-position correction (Maiden & Rodenburg, 2009; Thibault & Menzel, 2013; Dwivedi et al., 2018). Reconstruction proceeded for 800 iterations. The initial probe guess was defined by a 1 µm-diameter pinhole, and the initial sample estimate was uniform with unit amplitude and zero phase. The reconstructed-image pixel size was 5.765 nm. This reconstruction used a single dataset, without the lateral detector shifts used in the following measurement scheme.
Au nanocubes (Nanocube-90, NanoSeedz Ltd) deposited on a silicon nitride membrane (NX7150E, Norcada) served as the high-resolution test sample. Measurements were performed over a 15 × 15 raster grid with a 300 nm step and a 6.9 s exposure per point. Diffraction patterns were continuously recorded with the CITIUS 840k detector at 0.01 s per frame, yielding 690 frames per point. Before the first scan point in each row, beam-position drift was corrected using a dark-field knife-edge scan (Takahashi et al., 2011), corresponding to a correction interval of approximately 132 s. A single ptychographic scan took approximately 41 min. Following each ptychographic scan, the detector was shifted laterally within ±30 mm, and the same field of view was rescanned after stabilization. This procedure was repeated for five detector positions to extend the accessible spatial-frequency range. The combined scans covered spatial-frequency ranges of approximately −0.0925 to 0.0929 nm−1 vertically and −0.146 to 0.118 nm−1 horizontally. Details of the five in-plane detector positions are provided in Section S1 of the supporting information. The total radiation dose delivered to the Au nanocubes over all measurements was approximately 9.1 × 10⁸ Gy (Howells et al., 2009). Measurement time could be reduced while maintaining spatial resolution by increasing the TC slit size, using higher-numerical-aperture focusing optics, and implementing either on-the-fly scanning or a multi-beam approach (Pelz et al., 2014; Hirose et al., 2020b).
Reconstruction proceeded in three steps using a mixed-state ePIE algorithm (Maiden & Rodenburg, 2009; Thibault & Menzel, 2013), with a total of 650 iterations. First, a low-resolution image (20 nm pixel size) was reconstructed for 300 iterations from a single dataset using a unity object and the probe recovered from the Ta test chart. Second, the lower-resolution sample image and probe from the first step were resized to a 10 nm pixel size and used as initial estimates (Maiden et al., 2011). All five detector-position datasets were used in a joint reconstruction for 250 iterations. The sample image was shared across datasets, while each dataset had an independent three-mode mixed-state probe. Five independent probe functions allowed small field-of-view shifts between the datasets by using different probe center positions. Third, the sample image and probe functions were resized to a 3.43 nm pixel size and used as initial estimates for 100 iterations. In these steps, we applied a reciprocal-space probe constraint (Gardner et al., 2017) and phase-guided image filtering (Abe et al., 2024) with guide-image updates along the isotropic total variation (TV) norm descent direction. Position correction was also applied for individual scan-position shifts (Dwivedi et al., 2018). Additional details of the phase-retrieval procedure and reconstruction results without TV regularization are provided in Section S2 of the supporting information.
3. Results and discussion
3.1. Performance evaluation of the AKB-focused beam using a Ta test chart
Fig. 2(a) shows the diffraction intensity pattern recorded from the 100 nm-thick Ta test chart. Scattered signals were detected at spatial frequencies above 0.060 nm−1. Fig. 2(b) presents the amplitude image of the reconstructed incident wavefield. The beam size, evaluated as the full width at half-maximum, was approximately 0.8 µm (horizontal) × 1.0 µm (vertical). Fig. 2(c) shows the reconstructed phase image, where the smallest ∼20 nm features were clearly resolved. A point-like structure to the right of the central circle is due to a fabrication defect rather than a reconstruction artifact. This structure is also visible in the scanning electron microscopy image shown in Fig. S3. Fig. 2(d) displays a line profile across an edge structure. The edge-spread function was fitted with an error function, and the spatial resolution was estimated from the full width at half-maximum of the corresponding line-spread function, yielding approximately 13.2 nm on average. These measurements confirmed the focusing performance and the 10 nm-scale imaging capability of the system. Longer exposures were also tested to access the high-frequency scattering. However, signals above 0.10 nm−1 remained insufficiently distinct, likely because the test chart lacked sharp sub-10 nm features.
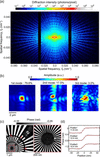 | Figure 2 (a) Diffraction pattern of a 100 nm-thick Ta test chart at 4.5 keV. (b) Amplitude image of the reconstructed probe function. (c) Reconstructed phase image of the test chart (left) and magnified view of finest structures (right). (d) Line profile across an edge in the reconstructed phase image and corresponding error-function fit. |
3.2. High-resolution ptychographic imaging of Au nanocubes
Metal nanocubes with sharp edge structures are commonly used to evaluate high spatial resolution performance (Yamaguchi et al., 2026). Fig. 3(a) shows a diffraction intensity pattern of the Au nanocubes accumulated over 6.9 s at a representative scan point. Speckles were recorded beyond 0.10 nm−1, indicating that spatial-frequency information relevant to ∼10 nm features was captured. Supplementary Videos S1 and S2 present diffraction patterns recorded at the same scan point with a 10 ms exposure per frame. Although the overall pattern shape remained similar, slight speckle fluctuations at low spatial frequencies were observed. Fluctuations at higher spatial frequencies were likely dominated by Poisson noise, whereas those at lower spatial frequencies may reflect temporal instabilities in the experimental system. Such instabilities could have caused wavefront-tilt variations and intensity fluctuations, resulting in the observed speckle fluctuations.
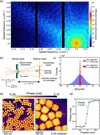 | Figure 3 (a) Diffraction pattern of Au nanocubes recorded at 4.5 keV. (b) Schematic of calculation of the wavefront-tilt change from the beam-centroid displacement. (c) Histogram of the wavefront tilt changes, Δθ, evaluated from centroid fluctuations in diffraction intensity patterns. σ is the standard deviation obtained by Gaussian fitting. (d) Reconstructed phase image of Au nanocubes (left) and enlarged view of the boxed region (right). (e) Line profile across an edge in the reconstructed Au-nanocube phase image and corresponding error-function fit. |
To evaluate wavefront-tilt variations that can blur the diffraction pattern during exposure, the displacement of the intensity centroid of the transmitted beam was analyzed. As shown schematically in Fig. 3(b), the centroid displacement in each frame relative to its time-averaged position was calculated with subpixel precision. The wavefront-tilt change, Δθ, was then obtained using the geometrical relation in equation (1),

where p is the detector pixel size, L is the camera length, Cg is the vertical or horizontal centroid position at time frame t, and  is its time-averaged value of Cg(t) at the same scan point. Fig. 3(c) shows a histogram of Δθ evaluated from 690 frames at each of the 1125 scan points. Angular changes were on the microradian scale, indicating that variations in mean wavefront tilt were small. Gaussian fits to the histograms gave standard deviations of 0.729 µrad vertically and 0.089 µrad horizontally. For such small variations, focal-position shifts are also expected to be suppressed because the AKB mirrors are coma-free (Matsuyama et al., 2017;Yamada et al., 2020). The anisotropy in the wavefront-tilt variation may originate from mechanical or thermal instability of upstream optics, such as the double-crystal monochromator. However, identifying the origin of this anisotropy is difficult because the observed fluctuations include contributions from several components, such as the source and stages. Section S4 of the supporting information provides a frequency-domain analysis of the low-angle scattering intensity, which suggests multiple frequency components. For future measurements, evaluating displacements and vibrations of the experimental components will be important for clarifying the origins of both the wavefront-tilt anisotropy and the temporal intensity fluctuations. The effects of thermal loads induced by X-ray irradiation on individual optical components should also be considered to improve system stability. Burst-mode techniques may also offer a more rigorous treatment of such temporal variations (Aidukas et al., 2024; Cheng et al., 2026). Applying burst-frame selection could improve the resolution, particularly in the vertical direction, where the positional fluctuations were larger than in the horizontal direction. This approach may therefore improve the resolution for a given radiation dose. However, in this study, illumination was assumed to be sufficiently stable during each exposure, and diffraction patterns accumulated over 690 frames were used for reconstruction.
Fig. 3(d) shows the phase image obtained by multi-dataset reconstruction. The Au particles were approximately 100 nm in size, and both cubic and rod-like morphologies were observed. Tender X-rays provided strong phase contrast because the phase shift of Au is larger at 4.5 keV than at hard-X-ray energies. The enlarged view of the boxed region clearly resolves the particle outlines, edge structures, and narrow gaps between adjacent particles. Fig. 3(e) shows an edge profile along the blue line in Fig. 3(d) and the corresponding error-function fit. The phase shift relative to the silicon nitride membrane was approximately 0.391 rad, corresponding to an Au thickness of approximately 116 nm (Henke et al., 1993). The spatial resolution, estimated from the full width at half-maximum of the line-spread function, was approximately 7.4 nm. At this resolution, the depth of field was roughly 258 nm (Tsai et al., 2016), indicating that the projection approximation was valid for the measured Au nanocubes.
3.3. Toward high-resolution ptychography at lower X-ray energies
In this study, signals above 0.10 nm−1 were recorded at 4.5 keV, yielding a real-space resolution of approximately 7.4 nm. Achieving high resolution requires speckles with sufficient photon counts, so we consider conditions that increase the photon count rate per speckle. When a sample is illuminated with a coherent beam of wavelength λ and beam size a, the photon count rate N(q), reaching a detector within a solid angle ΔΩ, at a scattering angle θ, can be expressed as in equation (2) (Dreiss et al., 2006),

where I0 is the incident in units of photons s−1, η is the detector Ts is the sample transmittance, ds is the sample thickness, (dΣ/dΩ)S is the differential scattering and q is the magnitude of the scattering vector, defined as q = (4π/λ)sin(θ/2). The corresponding spatial frequency is denoted by f = q/2π. The transverse spatial frequency is given by fx = (1/λ)sinθ, where fx = fcos(θ/2). The beam area A can be written as A = Ca2, where C depends on the beam shape. For a sample larger than the illuminated beam, the speckle width is given by  . The solid angle of a speckle ΔΩsp can therefore be approximated as in equation (3),

Combining these expressions yields the scaling relation in equation (4),

This relationship shows that the photon count rate per speckle scales with λ2 and the incident photon-flux density, I0/A. For a fixed exposure time t, the photon count scales with the incident fluence, I0t/A. Thus, focused low-energy X-rays can facilitate detection of high-spatial-frequency speckles through their longer wavelength and high fluence. The effects of photon energy and fluence on spatial resolution and signal-to-noise ratio have also been discussed using simplified models (Du & Jacobsen, 2018; Du et al., 2021). Using the dose–resolution relationship given in equation (3) of Howells et al. (2009), the dose required to image a 7.4 nm-sized Au voxel with statistical accuracy defined by the Rose criterion was estimated to be approximately 4.39 × 10⁷ Gy at 4.5 keV and 6.26 × 10⁷ Gy at 9 keV. Thus, the required dose at 4.5 keV is about 70% of that at 9 keV. Howells et al. also showed in Fig. 2(b) that, for a 10 nm protein feature, the required dose is lower at 2 keV than at 8 keV. These values suggest that tender X-rays can achieve a given resolution with a lower dose than hard X-rays under some conditions. However, this advantage depends on the sample. Lower photon energies can provide stronger scattering signals for relatively transparent samples. In thicker or more strongly absorbing samples, lower transmission can reduce the detected speckle intensity, and higher photon energies may provide better dose efficiency. Other factors must also be considered, including detector efficiency and the maximum measurable spatial frequency for a finite detector area and scanning range. At lower photon energies, stronger X-ray–matter interactions can also increase the risk of sample damage and carbon contamination at high doses (Mille et al., 2022; Vijayakumar et al., 2023). Photon energy should therefore be selected by balancing spatial resolution, sample transmission, detector efficiency, and acceptable radiation dose. Previous demonstrations of single-nanometre resolution have been restricted to soft or hard X-ray regimes; extending such performance into the tender X-ray region would bridge this gap and increase flexibility in photon-energy selection and sample preparation.
Expanding the present system's high-resolution capability to lower energies, such as 2.5 keV, requires alleviating limits on the maximum measurable spatial frequency imposed by detector area, detector-scanning range, and sample-to-detector distance. A straightforward approach is to shorten the sample-to-detector distance. This geometry allows higher-frequency scattering signals to fall within the detector area while maintaining the high efficiency of the CITIUS detector at low energies. However, a shorter distance reduces the probe reconstruction window, and probe intensity extending beyond this window can introduce artifacts. To mitigate this issue, illumination should be confined within the reconstruction area using a high-efficiency, large-numerical-aperture focusing optic designed for low-energy X-rays (Shimamura et al., 2024). When illumination extends outside the reconstruction area, the sPIE algorithm can help suppress artifacts (Batey et al., 2014; Li et al., 2026).
4. Conclusions
In this study, we demonstrated high-resolution X-ray ptychography in the tender X-ray region at the BL10U beamline of NanoTerasu, a 3 GeV synchrotron radiation facility operating at its design maximum current. Measurements were performed using the AKB mirror focusing optics and the CITIUS detector. After characterizing the beam with a Ta test chart, we evaluated the high-resolution imaging performance using Au nanocubes with sharp edge structures. Scattering signals from the Au nanocubes were recorded at spatial frequencies above 0.10 nm−1, and a clear phase image was obtained by multi-dataset reconstruction. Edge-response analysis of the reconstructed image yielded a projection spatial resolution of approximately 7.4 nm. These results demonstrate a substantial extension of the spatial-resolution capability of tender-X-ray ptychography at NanoTerasu BL10U.
High-resolution tender X-ray ptychography offers a favorable balance of penetration depth, image contrast, and radiation dose between the soft- and hard-X-ray regimes. In addition, the tender X-ray region also includes the K-edges of light elements such as sulfur and phosphorus and the L-edges of 4d transition metals. Therefore, phase or absorption imaging near these edges could enable high-resolution analysis of elemental distributions and chemical states in functional materials, such as sulfur speciation in lithium–sulfur battery materials (Sasaki et al., 2026b) and the chemical states of Ru- or Rh-based catalysts (Kawaguchi et al., 2019; Li et al., 2023). The present results provide a basis for extending high-resolution ptychographic imaging across the tender-X-ray energy range, thereby broadening the applicability of high-resolution X-ray microscopy to a wider range of samples.
Supporting information
Supporting information including detector positions, reconstruction details, SEM image, and temporal fluctuation analysis. DOI: https://doi.org/10.1107/S1600577526011549/ye5092sup1.pdf
Supporting information file. DOI: https://doi.org/10.1107/S1600577526011549/ye5092sup2.mp4
Supporting information file. DOI: https://doi.org/10.1107/S1600577526011549/ye5092sup3.mp4
Acknowledgements
The synchrotron radiation experiments in this study were conducted at the NanoTerasu BL10U beamline of the Photon Science Innovation Center (PhoSIC) under the Coalition Program. We would like to express our sincere gratitude to the QST Accelerator Group and PhoSIC beamline group for their invaluable support in the synchrotron radiation experiments. We extend our gratitude to Dr Hiroshi Chiba for his assistance with sample preparation.
Conflict of interest
The authors declare no conflicts of interest.
Funding information
This work was supported by the JSPS KAKENHI (JP23H05403, JP24H02205, JP26KJ0535) and the MEXT program: Data Creation and Utilization-Type Material Research and Development Project (JPMXP1122712807).
References
 Abe, M., Kaneko, F., Ishiguro, N., Kudo, T., Matsumoto, T., Hatsui, T., Tamenori, Y., Kishimoto, H. & Takahashi, Y. (2021). J. Synchrotron Rad. 28, 1610–1615. Web of Science CrossRef IUCr Journals Google Scholar
Abe, M., Takazawa, S., Uematsu, H., Sasaki, Y., Okawa, N., Ishiguro, N. & Takahashi, Y. (2024). Optica 11, 1708. CrossRef Google Scholar
Aidukas, T., Phillips, N. W., Diaz, A., Poghosyan, E., Müller, E., Levi, A. F. J., Aeppli, G., Guizar-Sicairos, M. & Holler, M. (2024). Nature 632, 81–88. Web of Science CrossRef CAS PubMed Google Scholar
Batey, D. J., Edo, T. B., Rau, C., Wagner, U., Pešić, Z. D., Waigh, T. A. & Rodenburg, J. M. (2014). Phys. Rev. A 89, 043812. CrossRef Google Scholar
Butcher, T. A., Finizio, S., Heller, L., Phillips, N. W., Sarafimov, B., Vaz, C. A. F., Kleibert, A., Watts, B., Holler, M. & Raabe, J. (2025). Rev. Sci. Instrum. 96, 123704. CrossRef PubMed Google Scholar
Chapman, H. N. & Nugent, K. A. (2010). Nat. Photon. 4, 833–839. Web of Science CrossRef CAS Google Scholar
Cheng, C.-Y., Yin, G.-C., Chen, B.-Y., Chen, H.-W., Lee, P.-W., Chu, K.-C., Lin, J.-M., Chen, C.-Y., Huang, Y.-S., Lin, C.-M. & Tsai, Y.-W. (2026). Opt. Express 34, 7650–7661. CrossRef PubMed Google Scholar
da Silva, J. C., Guilloud, C., Hignette, O., Jarnias, C., Ponchut, C., Ruat, M., Labiche, J.-C., Pacureanu, A., Yang, Y., Salome, M., Bohic, S. & Cloetens, P. (2019). J. Synchrotron Rad. 26, 1751–1762. CrossRef CAS IUCr Journals Google Scholar
Deng, J., Preissner, C., Klug, J. A., Mashrafi, S., Roehrig, C., Jiang, Y., Yao, Y., Wojcik, M., Wyman, M. D., Vine, D., Yue, K., Chen, S., Mooney, T., Wang, M., Feng, Z., Jin, D., Cai, Z., Lai, B. & Vogt, S. (2019). Rev. Sci. Instrum. 90, 083701. Web of Science CrossRef PubMed Google Scholar
Dreiss, C. A., Jack, K. S. & Parker, A. P. (2006). J. Appl. Cryst. 39, 32–38. Web of Science CrossRef CAS IUCr Journals Google Scholar
Du, M., Di, Z., Gürsoy, D., Xian, R. P., Kozorovitskiy, Y. & Jacobsen, C. (2021). J. Appl. Cryst. 54, 386–401. Web of Science CrossRef CAS IUCr Journals Google Scholar
Du, M. & Jacobsen, C. (2018). Ultramicroscopy 184, 293–309. Web of Science CrossRef CAS PubMed Google Scholar
Dwivedi, P., Konijnenberg, A. P., Pereira, S. F. & Urbach, H. P. (2018). Ultramicroscopy 192, 29–36. Web of Science CrossRef CAS PubMed Google Scholar
Gardner, D. F., Tanksalvala, M., Shanblatt, E. R., Zhang, X., Galloway, B. R., Porter, C. L., Karl, R. Jr, Bevis, C., Adams, D. E., Kapteyn, H. C., Murnane, M. M. & Mancini, G. F. (2017). Nat. Photon. 11, 259–263. Web of Science CrossRef CAS Google Scholar
Giewekemeyer, K., Beckers, M., Gorniak, T., Grunze, M., Salditt, T. & Rosenhahn, A. (2011). Opt. Express 19, 1037. Web of Science CrossRef PubMed Google Scholar
Górecki, R., Polo, C. C., Kalile, T. A., Miqueles, E. X. S., Tonin, Y. R., Upadhyaya, L., Meneau, F. & Nunes, S. P. (2023). Commun. Mater. 4, 68. Google Scholar
Henke, B. L., Gullikson, E. M. & Davis, J. C. (1993). At. Data Nucl. Data Tables 54, 181–342. CrossRef CAS Web of Science Google Scholar
Hirose, M., Higashino, T., Ishiguro, N. & Takahashi, Y. (2020b). Opt. Express 28, 1216. CrossRef PubMed Google Scholar
Hirose, M., Ishiguro, N., Shimomura, K., Nguyen, D.-N., Matsui, H., Dam, H. C., Tada, M. & Takahashi, Y. (2019). Commun. Chem. 2, 50. Web of Science CrossRef Google Scholar
Hirose, M., Shimomura, K., Higashino, T., Ishiguro, N. & Takahashi, Y. (2020a). J. Synchrotron Rad. 27, 455–461. CrossRef IUCr Journals Google Scholar
Hitchcock, A. P., Zhang, C., Eraky, H., Higgins, D., Belkhou, R., Millle, N., Swaraj, S., Stanescu, S., Sun, T. & Wang, J. (2024). J. Electron Spectrosc. Relat. Phenom. 276, 147487. Web of Science CrossRef Google Scholar
Howells, M. R., Beetz, T., Chapman, H. N., Cui, C., Holton, J. M., Jacobsen, C. J., Kirz, J., Lima, E., Marchesini, S., Miao, H., Sayre, D., Shapiro, D. A., Spence, J. C. H. & Starodub, D. (2009). J. Electron Spectrosc. Relat. Phenom. 170, 4–12. Web of Science CrossRef CAS Google Scholar
Johansson, U., Carbone, D., Kalbfleisch, S., Björling, A., Kahnt, M., Sala, S., Stankevic, T., Liebi, M., Rodriguez Fernandez, A., Bring, B., Paterson, D., Thånell, K., Bell, P., Erb, D., Weninger, C., Matej, Z., Roslund, L., Åhnberg, K., Norsk Jensen, B., Tarawneh, H., Mikkelsen, A. & Vogt, U. (2021). J. Synchrotron Rad. 28, 1935–1947. Web of Science CrossRef CAS IUCr Journals Google Scholar
Kawaguchi, T., Keller, T. F., Runge, H., Gelisio, L., Seitz, C., Kim, Y. Y., Maxey, E. R., Cha, W., Ulvestad, A., Hruszkewycz, S. O., Harder, R., Vartanyants, I. A., Stierle, A. & You, H. (2019). Phys. Rev. Lett. 123, 246001. Web of Science CrossRef PubMed Google Scholar
Kulow, A., Pérez, J., Boudjehem, R., Gautier, E., Pairis, S., Ould-Chikh, S., Hazemann, J.-L. & da Silva, J. C. (2024). J. Synchrotron Rad. 31, 867–876. CrossRef CAS IUCr Journals Google Scholar
Li, J., Jiang, Y., Zhang, Z., Tsuji, M., Miyazaki, M., Kitano, M. & Hosono, H. (2023). Adv. Energy Mater. 13, 2302424. CrossRef Google Scholar
Li, R., Xu, Z., Chen, S., Wu, S., Zhang, W., Zhang, X. & Tai, R. (2026). Opt. Express 34, 6677. CrossRef PubMed Google Scholar
Maiden, A. M., Humphry, M. J., Zhang, F. & Rodenburg, J. M. (2011). J. Opt. Soc. Am. A 28, 604. CrossRef Google Scholar
Maiden, A. M. & Rodenburg, J. M. (2009). Ultramicroscopy 109, 1256–1262. Web of Science CrossRef PubMed CAS Google Scholar
Matsuyama, S., Yasuda, S., Yamada, J., Okada, H., Kohmura, Y., Yabashi, M., Ishikawa, T. & Yamauchi, K. (2017). Sci. Rep. 7, 46358. Web of Science CrossRef PubMed Google Scholar
Miao, J. (2025). Nature 637, 281–295. Web of Science CrossRef CAS PubMed Google Scholar
Mille, N., Yuan, H., Vijayakumar, J., Stanescu, S., Swaraj, S., Desjardins, K., Favre-Nicolin, V., Belkhou, R. & Hitchcock, A. P. (2022). Commun. Mater. 3, 8. Web of Science CrossRef Google Scholar
Okui, M., Shimoguchi, A., Nagata, D., Fukuzawa, H., Yamane, H., Yoshida, J., Yato, N., Nakamura, T. & Ikeya, Y. (2026). Proceedings of the 13th International Conference on Mechanical Engineering Design of Synchrotron Radiation Equipment and Instrumentation (MEDSI2025), Lund, Sweden, pp. 395–398. THP52. Google Scholar
Pelz, P. M., Guizar-Sicairos, M., Thibault, P., Johnson, I., Holler, M. & Menzel, A. (2014). Appl. Phys. Lett. 105, 251101. Web of Science CrossRef Google Scholar
Pfeiffer, F. (2018). Nat. Photon. 12, 9–17. Web of Science CrossRef CAS Google Scholar
Rodenburg, J. M., Hurst, A. C., Cullis, A. G., Dobson, B. R., Pfeiffer, F., Bunk, O., David, C., Jefimovs, K. & Johnson, I. (2007). Phys. Rev. Lett. 98, 034801. Web of Science CrossRef PubMed Google Scholar
Sasaki, Y., Ishiguro, N., Abe, M., Takazawa, S., Okawa, N., Ikenaga, M., Kaneko, F. & Takahashi, Y. (2026b). Sci. Rep. 16, 26655. CrossRef PubMed Google Scholar
Sasaki, Y., Ishiguro, N., Abe, M., Takazawa, S., Uematsu, H., Okawa, N., Kaneko, F. & Takahashi, Y. (2026a). IUCrJ 13, 11–18. CrossRef CAS PubMed IUCr Journals Google Scholar
Schropp, A., Döhrmann, R., Botta, S., Brückner, D., Kahnt, M., Lyubomirskiy, M., Ossig, C., Scholz, M., Seyrich, M., Stuckelberger, M. E., Wiljes, P., Wittwer, F., Garrevoet, J., Falkenberg, G., Fam, Y., Sheppard, T. L., Grunwaldt, J.-D. & Schroer, C. G. (2020). J. Appl. Cryst. 53, 957–971. Web of Science CrossRef CAS IUCr Journals Google Scholar
Shapiro, D. A., Yu, Y.-S., Tyliszczak, T., Cabana, J., Celestre, R., Chao, W., Kaznatcheev, K., Kilcoyne, A. L. D., Maia, F., Marchesini, S., Meng, Y. S., Warwick, T., Yang, L. L. & Padmore, H. A. (2014). Nat. Photon. 8, 765–769. Web of Science CrossRef CAS Google Scholar
Shimamura, T., Takeo, Y., Moriya, F., Kimura, T., Shimura, M., Senba, Y., Kishimoto, H., Ohashi, H., Shimba, K., Jimbo, Y. & Mimura, H. (2024). Nat. Commun. 15, 665. Web of Science CrossRef PubMed Google Scholar
Takahashi, Y., Suzuki, A., Zettsu, N., Kohmura, Y., Senba, Y., Ohashi, H., Yamauchi, K. & Ishikawa, T. (2011). Phys. Rev. B 83, 214109. Web of Science CrossRef Google Scholar
Takeo, Y., Sakamoto, S., Furuya, N., Sakurai, K., Yoshinaga, K., O'Neal, J. T., Suzuki, A., Mimura, H., Matsuda, I., Harada, Y., Ohashi, H., Miwa, S. & Kimura, T. (2026). APS Open Sci. 1, L000022. Google Scholar
Thibault, P. & Menzel, A. (2013). Nature 494, 68–71. Web of Science CrossRef CAS PubMed Google Scholar
Tiwari, M. K., Gowrishankar, B., Raghuvanshi, V. K., Nandedkar, R. V. & Sawhney, K. J. S. (2002). Bull. Mater. Sci. 25, 435–441. CrossRef CAS Google Scholar
Tsai, E. H. R., Usov, I., Diaz, A., Menzel, A. & Guizar-Sicairos, M. (2016). Opt. Express 24, 29089. CrossRef PubMed Google Scholar
Vijayakumar, J., Yuan, H., Mille, N., Stanescu, S., Swaraj, S., Favre-Nicolin, V., Najafi, E., Hitchcock, A. P. & Belkhou, R. (2023). J. Synchrotron Rad. 30, 746–757. Web of Science CrossRef CAS IUCr Journals Google Scholar
Xu, W., Xu, W., Gao, Z., Gavrilov, D., Yan, H., Xu, H., Bouet, N., Zhou, J., Smith, R., Ma, J., Huang, X., Chu, Y. S. & Nazaretski, E. (2024). Rev. Sci. Instrum. 95, 113705. CrossRef Google Scholar
Yamada, J., Matsuyama, S., Hirose, R., Takeda, Y., Kohmura, Y., Yabashi, M., Omote, K., Ishikawa, T. & Yamauchi, K. (2020). Optica 7, 367. CrossRef Google Scholar
Yamaguchi, G., Yamada, J., Shioi, K., Osaka, T., Inoue, I., Inubushi, Y., Kameshima, T., Yamauchi, K. & Yabashi, M. (2026). Nat. Photon. 20, 721–726. CrossRef CAS Google Scholar
This is an open-access article distributed under the terms of the Creative Commons Attribution (CC-BY) Licence, which permits unrestricted use, distribution, and reproduction in any medium, provided the original authors and source are cited.
| JOURNAL OF SYNCHROTRON RADIATION |