

 menu


research papers
 | JOURNAL OF APPLIED CRYSTALLOGRAPHY |
 access
Simultaneous very small angle and small-angle neutron scattering measurements enabled by flat-panel-type photomultiplier detectors at SANS-J, JRR-3

aMaterials Sciences Research Center, Japan Atomic Energy Agency, 2-4 Shirakata, Tokai-mura, Ibaraki 319-1195, Japan
*Correspondence e-mail: [email protected]
We have replaced the conventional high-spatial-resolution photomultiplier-based neutron detector (PS-PMT; R3239, Hamamatsu), which has been widely used for very small angle neutron scattering (VSANS), with four flat-panel-type high-spatial-resolution photomultiplier detectors (FPDs; H12700A, Hamamatsu) arranged in a square array on the small-angle neutron scattering instrument SANS-J at the JRR-3 research reactor. The FPD system provides seamless detection of scattered neutrons over an effective area of 80 × 80 mm2, which is larger than that of the PS-PMT. Owing to the optimized design of the scintillator, optical diffuser and light shielding, the FPD exhibits improved detection efficiency, spatial resolution and signal-to-background ratio compared with the conventional PS-PMT. Furthermore, by exploiting the negligible dead area surrounding the neutron-sensitive region of the FPD, simultaneous and continuous VSANS and SANS measurements without gaps in Q were achieved. By combining the FPD with a downstream 3He main detector, a wide scattering-vector-magnitude range from approximately 10−3 to 0.3 nm−1 can be covered in a single measurement.
Keywords: very small angle neutron scattering; simultaneous VSANS and SANS measurements; flat-panel-type photomultiplier tube detectors.
1. Introduction
Following the development of neutron lenses (Choi et al., 2000 ; Oku et al., 2007) and high-spatial-resolution position-sensitive photomultiplier tubes (PS-PMTs; Hirota et al., 2005; Iwase et al., 2012), many small-angle neutron scattering (SANS) instruments have extended the accessible scattering-vector range to values of Q well below 0.01 nm−1 (Oku et al., 2007; Iwase et al., 2007; Iwase et al., 2011; Radulescu et al., 2012; Radulescu et al., 2016; Radulescu, 2025; Pipich & Fu, 2015; Wood et al., 2018; Barker et al., 2022; Zuo et al., 2024). At SANS-J, the SANS instrument installed at the Japan Research Reactor JRR-3, a PS-PMT positioned 10 m downstream of the sample enables measurements at scattering angles θ > 0.01° (Q > 0.002 nm−1). In this configuration, very small angle neutron scattering (VSANS) signals are separated from the non-scattered direct beam, which is tightly focused onto the PS-PMT using MgF2 neutron lenses (Kumada et al., 2023).
However, VSANS measurements using the PS-PMT suffer from three major limitations. First, the PS-PMT (R3239; Hamamatsu, Japan) has been discontinued and is no longer commercially available, necessitating the development of a replacement to ensure long-term operational reliability. Second, the acquisition time required for VSANS measurements is significantly longer than that for conventional SANS measurements. Whereas the incident neutron beam passes through an upstream slit with a square opening of Au = 20 mm for conventional SANS measurements, the aperture must be reduced to 3–5 mm in VSANS measurements to tightly focus the beam onto the PS-PMT, at the expense of beam intensity [Figs. 1(a) and 1(b)]. Third, the neutron-sensitive area of the PS-PMT available for SANS measurements is limited to approximately 74 mm in diameter (Iwase et al., 2011), which is insufficient for seamless coverage over a wide Q range. Although the beam center has been offset toward the edge of the sensitive area, the PS-PMT can measure scattering only up to Q ≃ 0.06 nm−1.
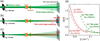 | Figure 1 Configurations for (a) SANS and (b) VSANS measurements with the PS-PMT, and (c) the newly developed configuration for simultaneous VSANS and SANS measurements with the FPD, together with (d) the calculated ΔQ/Q as a function of Q calculated using the resolution functions (Hammouda & Mildner, 2007 ). |
To overcome these limitations, we replaced the PS-PMT with four flat-panel-type multi-anode detectors, hereafter referred to as the FPD (Satoh, 2018). The FPD system outperforms the existing PS-PMT system at SANS-J not only in neutron detection area but also in spatial resolution, sensitivity and signal-to-background ratio (see below). Moreover, the neutron-sensitive area of the FPD is nearly equal to its projection area, and the detector operates directly inside the vacuum tube, whereas the PS-PMT was sealed in a 180 mm-diameter air chamber within the vacuum tube. As a result, the projection area of the FPD onto the downstream 3He main detector (Noda et al., 2016) is much smaller than that of the PS-PMT with its air chamber. By exploiting the small projection area of the FPD, we achieved simultaneous VSANS measurements with the FPD and SANS measurement with the 3He main detector over a Q range from ∼10−3 to 0.3 nm−1 [Fig. 1(c)]. Such simultaneous measurements reduce the total measurement time and enable the investigation of nano- and micro-scale structures in dynamically evolving samples without temporal offsets between different Q regions. A similar approach has been implemented at the VSANS instrument at the National Institute of Standards and Technology (NIST) (Barker et al., 2022), where horizontally and vertically arrayed multiple 3He detectors are arranged to form a central square opening that allows VSANS events to reach a high-spatial-resolution CCD-based scintillation detector positioned downstream. In contrast, our system provides a simpler experimental configuration, as simultaneous measurements can be performed without any opening in the 3He main detector by placing the FPD in front of it.
In this paper, we describe the performance of the FPD detector system, including the scintillator and readout electronics, and discuss the feasibility and performance of simultaneous VSANS and SANS measurements based on representative experimental results.
2. Experiment
Fig. 2 shows photographs of (a) the previously used PS-PMT in an air chamber and (b) the newly installed FPD unit immediately upstream of the main detector in a vacuum flight tube. The FPD is smaller than the PS-PMT. This is because the PS-PMT is housed in a 180 mm-diameter atmospheric chamber to prevent discharge, whereas the FPD operates in vacuum.
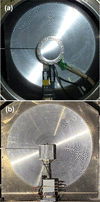 | Figure 2 Photographs of (a) the previously used PS-PMT in an air chamber and (b) the FPD placed immediately upstream of the main detector. |
Fig. 3 shows the internal configuration of the FPD unit. It consists of a 0.2 mm-thick aluminium light shield, a 0.5 mm-thick 6LiF–ZnS scintillator composite (EJ-426HD-PE; Eljen, USA), a 5 mm-thick non-frosted borosilicate glass plate, four flat-panel-type multi-anode photomultiplier tube assemblies (H12700A; Hamamatsu, Japan) arranged in a square array and a resistive charge-division readout circuit. The scintillation light generated by neutron-induced nuclear reactions was spread in the glass plate within the critical angle for total internal reflection (43°) and detected by the multi-anodes of the H12700A with a 6 mm pitch. Here, the borosilicate glass plate instead of quartz was used behind the scintillator to absorb transmitted neutrons, which backscatter and scintillate light over a wide area of the scintillator. The detected signals were processed by the resistive charge-division circuit, amplified and digitized using the NEUNET readout system (Satoh et al., 2004; Satoh et al., 2009). The centroid position was calculated from the current ratio of the signals at the two ends.
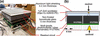 | Figure 3 (a) Internal configuration of the FPD unit. (b) Schematic illustration of the sub-pixel neutron position determination mechanism. |
3. Results and discussion
Fig. 4 shows the FPD image obtained under a uniformly distributed neutron field. Gapless images were obtained with the four H12700As units, because the neutron detection area (48.5 × 48.5 mm2) is almost equal to the projection area (51.75 × 51.75 mm2) of each H12700A. A cross-shaped dip accompanied by neighboring peaks is observed at the boundaries between adjacent H12700A units. Signals outside the region defined by 17 ≤ X ≤ 96 mm and 13 ≤ Y ≤ 90 mm were excluded from the subsequent data analysis.
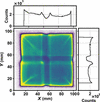 | Figure 4 FPD image for a uniformly distributed neutron field. The right and top plots show the vertical and horizontal line profiles. The total acquisition time was 39600 s. |
Fig. 5 shows a neutron transmission image of a cadmium mask with 1 mm-diameter holes arranged at 4 mm intervals on the FPD. The peaks are approximately equally spaced; however, the spacing becomes smaller near the edges and larger at the boundaries between adjacent H12700A units. The uneven count distribution, variations in peak spacing and positional deviations observed at the boundaries in Figs. 4 and 5 are probably caused by and a slight shift of the signal centroid derived from the anode arrays across the boundary gaps relative to the scintillation light distribution on the H12700As. The count rate at each pixel was normalized by that in Fig. 4 to correct variations in sensitivity. On the other hand, the positional deviation ΔX, corresponding to the difference between the observed peak position Xpeak and the hole position of the mask Xhole, was ignored in the SANS measurements. When the beam is centered on one of the four H12700As at X = X0, the ratio ΔX / (X − X0), corresponding to the Q shift induced by the positional deviation of the FPD, is at most 0.06. Because this value is much smaller than the typical neutron wavelength resolution in SANS, Δλ/λ = 0.15, one of the major factors determining the Q resolution, the ΔX of the FPD has a negligible impact on SANS measurements.
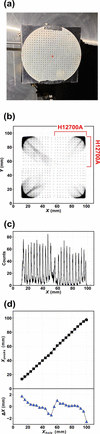 | Figure 5 (a) Cadmium mask attached to the FPD. (b) Neutron transmission image through the mask. (c) Line profile along the X direction at Y = 48–51 mm. (d) Plots of Xpeak versus Xhole and ΔX versus Xhole. The total acquisition time was 7200 s. |
Fig. 6 shows a neutron transmission image obtained through an L-shaped cadmium mask rotated by 180° on the FPD and its horizontal line profiles at Y = 20–40 and 68–89 mm. The two mask edges are positioned at the center of one H1200A and at the boundary between adjacent H12700As, respectively. The edge responses in the line profiles h(X), representing the neutron counts as a function of X, were fitted with an error function,

Here, hlow and hhigh are are the lower and upper count levels, Xedge is the fitted position of the mask edge, and σ is the standard deviation of the Gaussian spatial response, which is 0.28 mm at the center and 0.45 mm at the boundary. The former value is smaller than that of the PS-PMT of 0.45 mm (Iwase et al., 2011), whereas the latter value is comparable.
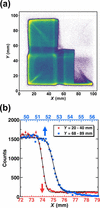 | Figure 6 (a) The cadmium-masked FPD image. (b) The X-direction line profiles and the fits by equation (1) . |
Fig. 7(a) shows the total counting rate over the entire FPD detector for the neutron beam transmitted through a high-density polyethylene (PE) attenuator. The neutron beam with Au = 5 and 20 mm was tightly focused (Hiroi et al., 2026) near the FPD, located 1.5 m downstream of the sample position, in order to investigate the saturation behavior of the FPD counting rate as a function of neutron beam intensity. For Au = 20 mm, the count rate increased exponentially as the PE thickness decreased; however, it showed saturation behavior above approximately 40000 counts per second for PE thicknesses below 2 mm. In contrast, for Au = 5 mm, the counting rate followed an exponential dependence down to zero PE thickness. The counting dead time estimated from the saturation behavior was 6.01 ± 0.01 µs, which is close to the scintillation decay time of the scintillator of 6.9 µs (Sykora et al., 2018). These results indicate that the maximum counting rate was limited by the scintillation decay time.
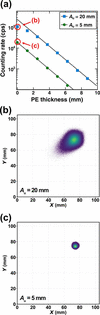 | Figure 7 (a) Count rate over the entire detector as a function of the PE thickness for the tight focusing neutron beam. Each data point was acquired for 20 s. (b, c) FPD images of the unattenuated neutron beam (zero PE thickness). |
Figs. 7(b) and 7(c) show FPD images of the unattenuated neutron beam. For the beam with Au = 20 mm, not only count loss but also a streak extending toward the center of the detector unit was observed. In contrast, for the beam with Au = 5 mm, neither count loss nor streak appeared. Thus, with Au = 5 mm, the FPD simultaneously measures the very small angle scattering signal and the transmitted beam intensity, which is used to determine the sample transmission.
From this point onward, we compare the data obtained with the FPD and the PS-PMT using intensity versus Q plots. Note that the following data were obtained by placing 1 cm-side right-angled isosceles cadmium masks at the four corners of the FPD to suppress streaks extending from the corners toward the center, as observed in Figs. 4–6.
Fig. 8 compares the direct-beam profiles of the focusing beams without a sample, normalized to the intensity at Q → 0 nm−1, so that differences at higher Q mainly reflect detector-related background. Although the normalized intensities measured with both the PS-PMT and FPD sharply decreased with increasing Q up to Q = 6 × 10⁻³ nm−1, they showed shallower slopes at higher Q values. The normalized intensity of the shallow-slope component is higher for the PS-PMT than for the FPD, indicating that this component mainly originates from detector-related background scattering rather than from the beam profile itself.
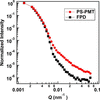 | Figure 8 Intensity versus Q plots of the focusing beam measured with the PS-PMT (circles) and the FPD (squares) using an upstream slit aperture (Au) of 2 mm. The intensity at Q → 0 nm−1 was normalized to unity. The acquisition time for each measurement was 3600 s. |
The normalized intensity of the shallow-slope component for the FPD was reduced by a factor of up to ten compared with that for the PS-PMT, suggesting that the background contribution observed with the FPD was substantially lower than that with the PS-PMT. It has been reported that scattering from the MgF2 lens contributes to the sloping background observed at Q > 6 × 10⁻³ nm−1 in the focusing configuration (Barker et al., 2008; Barker & Mildner, 2015; Glinka et al., 2015; Kumada et al., 2024). If the lens scattering contribution were eliminated, the superiority of the FPD in terms of detector-related background could become even more evident than indicated by the observed intensity ratio of the shallow-slope component. The reason for this remarkably low detector-related background remains unclear.
Fig. 9 shows the scattering intensity versus Q plot of polystyrene nanoparticles having a nominal diameter of 508 nm with a standard deviation of 8.5 nm (3500A, Thermo Fisher, USA) dispersed in H2O at 1 wt% in a 1 mm-thick quartz cell, measured with the PS-PMT and the FPD using Au = 2 mm. The background signal was subtracted to extract the scattering intensity. While hardly a single fringe can be identified with the PS-PMT, four fringe oscillations are observed in the scattering curve measured with the FPD. These performance improvements of the FPD can be attributed to two factors: the enhanced scintillation efficiency achieved using a thicker scintillator, and the lower background level of the FPD system, as shown in Fig. 8.
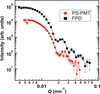 | Figure 9 Intensity versus Q plot of 508 nm-diameter polystyrene nanoparticles measured with the focusing beam (Au = 2 mm) using the PS-PMT for 1800 s and the FPD for 2000 s. The intensities were scaled by the incident neutron counts to evaluate the improvement in the signal-to-noise ratio resulting from the higher of the FPD. The dashed lines represent the theoretical curves smeared by the instrumental resolution. |
In addition to its high technical performance, the compact size of the FPD is another major advantage for simultaneous measurements. Fig. 10 shows the results of simultaneous VSANS and SANS measurements of polystyrene nanoparticles using the main 3He detector and the FPD in the focusing configuration with Au = 5 mm. The Q ranges covered by the FPD and the 3He detector overlapped in the range of 0.05 and 0.07 nm−1. In addition, the two detectors exhibited comparable values of ΔQ/Q within this overlapping region, as shown in Fig. 1(d). These features enabled the two scattering curves to be merged smoothly, thereby achieving gapless simultaneous measurements over a Q range from 0.0045 to 0.35 nm−1.
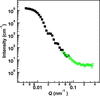 | Figure 10 Intensity versus Q plots of the 508 nm-diameter polystyrene nanoparticles measured simultaneously with the FPD (filled squares) and the 3He main detector (open circles) in the focusing configuration shown in Fig. 1 (c) using an upstream slit aperture (Au) of 5 mm for 21600 s. The intensities obtained with both detectors were calibrated on an absolute scale using the calculated scattering intensity of the polystyrene nanoparticles. |
In previously reported setups for simultaneous VSANS and SANS measurements (Barker et al., 2022), the 3He main detector for SANS consists of multiple one-dimensional 3He detector units arranged vertically and horizontally to form a central aperture for VSANS measurements using a downstream high-spatial-resolution CCD-based scintillation detector. In contrast, our setup achieves simultaneous measurements simply by placing the compact FPD in front of a conventional main detector consisting of a single 3He detector array unit, thereby significantly simplifying the detector configuration.
The simultaneous measurement scheme offers two principal benefits. First, it reduces the number of detector reconfigurations required per sample, thereby improving measurement throughput. As described above, the detector configuration for the simultaneous VSANS and SANS measurements allows concurrent acquisition of the scattering beam and transmission. Second, the method enables time-resolved in situ measurements of nanoscale structural evolution. The simultaneous VSANS/SANS measurements provide continuous structural information over real-space length scales ranging from approximately 20 nm to 1 µm in a single measurement. This capability is expected to facilitate in situ studies of material aggregation, disintegration and microphase transition under external fields (Miyamoto et al., 2007; Motokawa et al., 2007; Motokawa et al., 2016; Iwase et al., 2009; Nishijima et al., 2016; Hirata et al., 2025) without concerns about time loss associated with changes in detector configuration.
4. Conclusion
The FPD enables seamless detection of scattered neutrons over an effective area of approximately 80 × 80 mm2, which is larger than that of the PS-PMT. In combination with optimization of the scintillator, optical diffuser and light-shielding structure, the FPD exhibits superior performance compared with the PS-PMT in terms of detection efficiency, spatial resolution and signal-to-background ratio. Furthermore, by exploiting the negligible neutron-insensitive regions surrounding the detection area, simultaneous VSANS and SANS measurements were achieved in the Q range from the order of 10−3 to 0.3 nm−1 using the FPD together with the downstream 3He main detector. This capability is expected to enable high-throughput measurements and to facilitate time-resolved studies.
The FPD is also planned to be installed at a newly constructed SANS instrument located adjacent to SANS-J at JRR-3. Similar to the VSANS instrument at NIST (Barker et al., 2022) and the Bio-SANS instrument at the High Flux Isotope Reactor at Oak Ridge National Laboratory (Heller et al., 2014), the new instrument will employ multiple 3He detector banks positioned at different sample-to-detector distances to enable simultaneous measurements over the high-, medium- and small-angle scattering regions. By further incorporating the FPD into this detector configuration, truly simultaneous measurements spanning high-angle, medium-angle, small-angle and very small angle scattering are expected to be realized, covering an extended range of scattering-vector values from approximately 0.002 to 6 nm−1.
Acknowledgements
We acknowledge Mr Setsuo Satoh and Dr Tomohiro Seya of the High Energy Accelerator Research Organization (KEK) and Dr Hiroki Iwase of the Neutron Science and Technology Center at the Comprehensive Research Organization for Science and Society (CROSS) for their valuable input. We also thank the machine shop of JAEA for fabricating the instruments. The experiments at SANS-J were performed under the JRR-3 user programme (proposal Nos. 2024-I077 and 2025-I203).
Conflict of interest
We have no conflict of interest.
Data availability
The data supporting the results can be accessed upon request.
Funding information
Grant-in-Aid for Scientific Research from the Ministry of Education, Culture, Sports, Science and Technology, Japan (grant No. 21H03741).
References
 Barker, J., Moyer, J., Kline, S., Jensen, G., Cook, J., Gagnon, C., Kelley, E., Chabot, J. P., Maliszewskyj, N., Parikh, C., Chen, W., Murphy, R. P. & Glinka, C. (2022). J. Appl. Cryst. 55, 271–283. Web of Science CrossRef CAS IUCr Journals Google Scholar
Barker, J. G. & Mildner, D. F. R. (2015). J. Appl. Cryst. 48, 1055–1071. Web of Science CrossRef CAS IUCr Journals Google Scholar
Barker, J. G., Mildner, D. F. R., Rodriguez, J. A. & Thiyagarajan, P. (2008). J. Appl. Cryst. 41, 1003–1008. Web of Science CrossRef CAS IUCr Journals Google Scholar
Choi, S.-M., Barker, J. G., Glinka, C. J., Cheng, Y. T. & Gammel, P. L. (2000). J. Appl. Cryst. 33, 793–796. Web of Science CrossRef CAS IUCr Journals Google Scholar
Glinka, C. J., Barker, J. G. & Mildner, D. F. R. (2015). Nucl. Instrum. Methods Phys. Res. A 795, 122–127. CrossRef Google Scholar
Hammouda, B. & Mildner, D. F. R. (2007). J. Appl. Cryst. 40, 250–259. Web of Science CrossRef CAS IUCr Journals Google Scholar
Heller, W. T., Urban, V. S., Lynn, G. W., Weiss, K. L., O'Neill, H. M., Pingali, S. V., Qian, S., Littrell, K. C., Melnichenko, Y. B., Buchanan, M. V., Selby, D. L., Wignall, G. D., Butler, P. D. & Myles, D. A. (2014). J. Appl. Cryst. 47, 1238–1246. Web of Science CrossRef CAS IUCr Journals Google Scholar
Hirata, Y., Kaneko, F., Radulescu, A., Nishizu, T., Katsuno, N., Imaizumi, T., Motokawa, R., Kumada, T. & Nakagawa, H. (2025). J. Appl. Glycosci. 72, 7201102. CrossRef Google Scholar
Hiroi, K., Nakabe, R., Oku, T., Kumada, T. & Motokawa, R. (2026). J. Appl. Cryst. 59, 69–79. CrossRef IUCr Journals Google Scholar
Hirota, K., Shinohara, T., Ikeda, K., Mishima, K., Adachi, T., Morishima, T., Satoh, S., Oku, T., Yamada, S., Sasao, H., Suzuki, J. & Shimizu, H. M. (2005). Phys. Chem. Chem. Phys. 7, 1836–1838. Web of Science CrossRef PubMed CAS Google Scholar
Iwase, H., Endo, H., Katagiri, M. & Shibayama, M. (2011). J. Appl. Cryst. 44, 558–568. Web of Science CrossRef CAS IUCr Journals Google Scholar
Iwase, H., Katagiri, M. & Shibayama, M. (2012). J. Appl. Cryst. 45, 507–512. Web of Science CrossRef CAS IUCr Journals Google Scholar
Iwase, H., Koizumi, S., Iikura, H., Matsubayashi, M., Yamaguchi, D., Maekawa, Y. & Hashimoto, T. (2009). Nucl. Instrum. Methods Phys. Res. A 605, 95–98. CrossRef Google Scholar
Iwase, H., Koizumi, S., Suzuki, J., Oku, T., Sasao, H., Tanaka, H., Shimizu, H. M. & Hashimoto, T. (2007). J. Appl. Cryst. 40, s414–s417. Web of Science CrossRef CAS IUCr Journals Google Scholar
Kumada, T., Motokawa, R. & Iwase, H. (2024). J. Appl. Cryst. 57, 728–733. Web of Science CrossRef CAS IUCr Journals Google Scholar
Kumada, T., Motokawa, R., Oba, Y., Nakagawa, H., Sekine, Y., Micheau, C., Ueda, Y., Sugita, T., Birumachi, A., Sasaki, M., Hiroi, K. & Iwase, H. (2023). J. Appl. Cryst. 56, 1776–1783. Web of Science CrossRef CAS IUCr Journals Google Scholar
Miyamoto, N., Inoue, Y., Koizumi, S. & Hashimoto, T. (2007). J. Appl. Cryst. 40, s568–s572. CrossRef IUCr Journals Google Scholar
Motokawa, R., Koizumi, S., Zhao, Y. & Hashimoto, T. (2007). J. Appl. Cryst. 40, s645–s649. CrossRef IUCr Journals Google Scholar
Motokawa, R., Taniguchi, T., Kumada, T., Iida, Y., Aoyagi, S., Sasaki, Y., Kohri, M. & Kishikawa, K. (2016). Macromolecules 49, 6041–6049. CrossRef Google Scholar
Nishijima, H., Tomota, Y., Su, Y., Gong, W. & Suzuki, J. (2016). Metals 6, 16. CrossRef Google Scholar
Noda, Y., Koizumi, S. & Yamaguchi, D. (2016). J. Appl. Cryst. 49, 128–138. Web of Science CrossRef CAS IUCr Journals Google Scholar
Oku, T., Iwase, H., Shinohara, T., Yamada, S., Hirota, K., Koizumi, S., Suzuki, J., Hashimoto, T. & Shimizu, H. M. (2007). J. Appl. Cryst. 40, s408–s413. Web of Science CrossRef CAS IUCr Journals Google Scholar
Pipich, V. & Fu, Z. (2015). J. Large-Scale Res. Facil. 1, A31. CrossRef Google Scholar
Radulescu, A. (2025). QuBS 9, 6. Web of Science CrossRef Google Scholar
Radulescu, A., Pipich, V., Frielinghaus, H. & Appavou, M. S. (2012). J. Phys. Conf. Ser. 351, 012026. CrossRef Google Scholar
Radulescu, A., Szekely, N. K., Appavou, M.-S., Pipich, V., Kohnke, T., Ossovyi, V., Staringer, S., Schneider, G. J., Amann, M., Zhang-Haagen, B., Brandl, G., Drochner, M., Engels, R., Hanslik, R. & Kemmerling, G. (2016). JoVE, e54639. Google Scholar
Satoh, S. (2018). Plasma Fusion Res. 13, 2405056. CrossRef Google Scholar
Satoh, S., Ino, T., Furusaka, M., Kiyanagi, Y., Sakamoto, N. & Sakai, K. (2004). Nucl. Instrum. Methods Phys. Res. A 529, 421–424. CrossRef Google Scholar
Satoh, S., Muto, S., Kaneko, N., Uchida, T., Tanaka, M., Yasu, Y., Nakayoshi, K., Inoue, E., Sendai, H., Nakatani, T. & Otomo, T. (2009). Nucl. Instrum. Methods Phys. Res. A 600, 103–106. CrossRef Google Scholar
Sykora, G. J., Schooneveld, E. M. & Rhodes, N. J. (2018). Nucl. Instrum. Methods Phys. Res. A 883, 75–82. CrossRef Google Scholar
Wood, K., Mata, J. P., Garvey, C. J., Wu, C.-M., Hamilton, W. A., Abbeywick, P., Bartlett, D., Bartsch, F., Baxter, P., Booth, N., Brown, W., Christoforidis, J., Clowes, D., d'Adam, T., Darmann, F., Deura, M., Harrison, S., Hauser, N., Horton, G., Federici, D., Franceschini, F., Hanson, P., Imamovic, E., Imperia, P., Jones, M., Kennedy, S., Kim, S., Lam, T., Lee, W. T., Lesha, M., Mannicke, D., Noakes, T., Olsen, S. R., Osborn, J. C., Penny, D., Perry, M., Pullen, S. A., Robinson, R. A., Schulz, J. C., Xiong, N. & Gilbert, E. P. (2018). J. Appl. Cryst. 51, 294–314. Web of Science CrossRef CAS IUCr Journals Google Scholar
Zuo, T., Han, Z., Ma, C., Xiao, S., Lin, X., Li, Y., Wang, F., He, Y., He, Z., Zhang, J., Wang, G. & Cheng, H. (2024). J. Appl. Cryst. 57, 380–391. Web of Science CrossRef CAS IUCr Journals Google Scholar
This is an open-access article distributed under the terms of the Creative Commons Attribution (CC-BY) Licence, which permits unrestricted use, distribution, and reproduction in any medium, provided the original authors and source are cited.
| JOURNAL OF APPLIED CRYSTALLOGRAPHY |