


 menu


research papers
 access
High-pressure macromolecular crystallography as a tool for studying protein flexibility

aCenter for Free-Electron Laser Science CFEL, Deutsches Elektronen-Synchrotron DESY, Notkestraße 85, Hamburg 22607, Germany, bDeutsches Elektronen-Synchrotron DESY, Notkestraße 85, Hamburg 22607, Germany, cZBH - Center for Bioinformatics, Universität Hamburg, Bundesstraße 43, Hamburg 20146, Germany, dGALAB Laboratories GmbH, Am Schleusengraben 7, Hamburg 21029, Germany, eInstitute of Protein Research, Russian Academy of Sciences, Pushchino, Moscow Region 142290, Russian Federation, fDepartment of Physics, Universität Hamburg, Luruper Chausee 149, Hamburg 22761, Germany, and gCentre for Ultrafast Imaging CUI, Universität Hamburg, Luruper Chaussee 149, Hamburg 22761, Germany
*Correspondence e-mail: [email protected]
Protein function depends on their conformational flexibility. Complementary to temperature-dependent studies, high-pressure (HP) macromolecular crystallography is well suited to exploring the conformational space of proteins at atomic resolution. We have developed a new HP cell concept for macromolecular X-ray crystallography that overcomes the limitations of current devices. It consists of a single-crystalline sapphire capillary, which is loaded with multiple crystals and pressurized with helium at freely adjustable gas pressures of up to 120 MPa. Studying five different proteins, we generally observed a compression of the protein structures and a decrease in thermal displacement parameters at high pressure. Structurally, observations included the compression of a central tunnel of a biotechnologically relevant enzyme and the stabilization of ligand binding in the membrane protein photosynthetic reaction center of Cereibacter sphaeroides. For two pharmaceutically relevant proteins, the human kinase DRAK2 and SARS-CoV-2 main protease, we identified concerted movements of subdomains. Such knowledge is essential for predictions of protein dynamics and defined conformational states, offering the potential for improved structure-based drug development.
Keywords: high-pressure crystallography; sapphire cells; proteins under pressure; protein dynamics; protein structure; X-ray crystallography.
PDB references: RNase A at atmospheric pressure, 7q75; RNase A at 22 MPa, 7q76; RNase A at 50 MPa, 7q77; RNase A at 72 MPa, 7q78; RNase A at 100 MPa, 7q79; RNase A at 120 MPa, 7q7a; RNase A at atmospheric pressure after pressure release, 7q7b; DRAK2 at atmospheric pressure, 7q7c; DRAK2 at 110 MPa, 7q7d; DRAK2 at atmospheric pressure after pressure release, 7q7e; photosynthetic reaction center at atmospheric pressure, 7q7f; photosynthetic reaction center at 30 MPa, 7q7g; photosynthetic reaction center at 51 MPa, 7q7h; photosynthetic reaction center at 75 MPa, 7q7j; photosynthetic reaction center at 100 MPa, 7q7m; photosynthetic reaction center at 120 MPa, 7q7n; photosynthetic reaction center at atmospheric pressure after pressure release, 7q7o; N-acetylglucosamine 2-epimerase at atmospheric pressure, 8bry; N-acetylglucosamine 2-epimerase at 52 MPa, 8brz; N-acetylglucosamine 2-epimerase at 80 MPa, 8bs0; SARS-CoV-2 main protease at atmospheric pressure, 8bs1; SARS-CoV-2 main protease at 104 MPa, 8bs2
1. Introduction
Proteins fulfill various functions in the cell, such as performing enzymatic reactions, transducing signals via allosteric pathways, transporting molecules, or regulating genes by binding to DNA. The functionality of a protein relies on a well defined degree of flexibility, the so-called conformational space, which is inherently encoded in the three-dimensional structure of the protein. This conformational space is not only determined by the biochemical environment of the protein, i.e. the presence or absence of certain ligands or substrates, its solvents or other protein binding partners, but is also altered by physical parameters such as temperature and pressure (Winter, 2019 ). X-ray crystallography is a powerful technique to determine protein structures and investigate protein dynamics (Rhodes, 2006; Afonine et al., 2025). Multi-temperature diffraction experiments conducted between 100 K and room temperature provide mechanistic insights into protein function by revealing various intermediate states indicated to be functionally relevant (Keedy et al., 2015; Fischer et al., 2015; Günther et al., 2021; Stachowski & Fischer, 2026). Experiments at elevated pressures also allow insights into intermediate states (Fourme et al., 2012). Depending on the applied pressure, effects on proteins range from cavity volume changes, altered substrate binding, changes in catalytic turnover rates, shifts in the enantioselectivity of enzymes, dissociation of oligomeric complexes, or even denaturation by unfolding of the protein in extreme cases (Winter & Dzwolak, 2004; Eisenmenger & Reyes-De-Corcuera, 2009; Pattni & Heyden, 2019; Prangé et al., 2022; Akasaka, 2025). Hence, HP studies of protein structures have the potential to elucidate details of enzymatic reaction mechanisms and protein unfolding processes, or can answer the question of how proteins adapt to natural HP habitats such as the deep sea or the Earth's crust (Sieg et al., 2022). This knowledge ultimately enables several HP applications, such as the design of pressure-adapted enzymes for optimized performance in biotechnological processes and food processing at ≥100 MPa (Prangé et al., 2022; Yamamoto, 2017).
Unlike temperature-dependent studies, experiments at elevated pressures are more demanding due to technical challenges, such as the pressure stability of the equipment and the achievable signal-to-noise ratio limited by signal transmission through the sample containment – although the state of the art is constantly improving. In addition to X-ray crystallography, current methods used in HP studies involve various spectroscopic and scattering techniques including NMR spectroscopy (Winter & Dzwolak, 2004; Collins et al., 2011). Whereas devices for HP NMR spectroscopy are currently limited to a few hundred megapascals, diamond anvil cells (DACs) commonly used in HP X-ray crystallography can generate pressures of hundreds of gigapascals as they are designed for experiments under extreme conditions in geological and materials sciences (Kurpiewska et al., 2023). HP cryocooling of protein crystals at pressures of up to 500 MPa is another approach in HP crystallography, primarily developed to avoid the need for cryoprotectants (Kim et al., 2005; Burkhardt et al., 2012). Despite the variety of different experimental techniques, as of January 2026 only approximately 30 individual proteins had been studied at pressures higher than 20 MPa and approximately 230 structures had been deposited in the Protein Data Bank (Berman et al., 2003) (https://wwpdb.org; see Table S5 in the supporting information for details of pressure-related depositions). A wider application is probably hindered by technical limitations of current methods.
Commonly used DACs possess several disadvantages for the measurement of biological samples such as protein crystals. Crystal loading into a DAC is time consuming, sensitive crystals are potentially damaged during loading and pressurization, and they typically provide space for very few crystals, thereby hampering structure determinations from low-symmetry crystals (Kurpiewska et al., 2023). Further, it is difficult to adjust and measure accurately the pressure inside the DAC at moderate pressures relevant for biological samples, as the typically applied monitoring of the fluorescence shift of a ruby chip inside the DAC is temperature dependent and the derived pressure values are only reliable at pressures above 1 GPa (Ragan et al., 1992; Grasset, 2001). To overcome these practical challenges of DACs, we developed a new cell concept for HP macromolecular crystallography experiments in the biologically relevant pressure range of 0.1 to 120 MPa, the latter corresponding to the pressure in the deep sea 12 kilometres below sea level. The device is based on a thin-walled sapphire capillary in combination with a fixed-target sample holder, using helium gas as the pressurizing agent.
Here we present the results of crystallographic studies of five different proteins measured at pressures up to 120 MPa using our new HP cell. We demonstrate that HP crystallography with this cell concept enables the investigation of scientifically relevant macromolecular crystals, including membrane proteins, and small and fragile crystals of low symmetry such as the SARS-CoV-2 main protease (Mpro). Our experiments allowed us to identify concerted movements of subdomains, reflecting inherent protein flexibility, as well as altered ligand binding.
2. Materials and methods
2.1. HP setup and HP cell for macromolecular crystallography experiments
The new multi-crystal HP crystallography concept essentially consists of two main components: the pressure cell itself, which contains the samples, and a two-stage pressure booster that supplies the appropriate gas pressure for the experiments. The two components are connected by very thin and therefore flexible pressure-resistant capillaries.
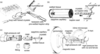
The pressure cell was designed and manufactured by suna-precision GmbH. The basic design (Fig. 1) consists of a sapphire capillary that is clamped into a holder and can be pressurized from both sides via connected high-pressure capillaries. The decision to use a capillary as a pressure cell arose because other geometries – such as a blind hole – were technically unfeasible or would have resulted in excessive internal stresses. Single-crystal sapphire was selected as the material for the capillary because, on the one hand, it is colorless and optically transparent, allowing sample centering to be performed with the on-axis microscope on the beamline, and, on the other hand, because sapphire capillaries can be manufactured as a single-crystalline material, so that only a few Bragg reflections from the capillary material itself are generated which would interfere with the diffraction pattern of the sample. Furthermore, aluminium and oxygen have comparatively low absorption cross sections for X-rays, meaning that the comparatively weak Bragg reflections from the protein crystals are only slightly attenuated. Pictures of the HP cell parts and technical details are provided in the supplementary information (Figs. S5 and S6). The capillaries used typically have an inner diameter of about 0.6 mm and an outer diameter of 3 mm. In our experiments, the capillaries could routinely withstand pressures of more than 120 MPa. For loading of the crystals, they are first placed on a Kapton sample holder, which is then inserted into the capillary from the side. To prevent the crystals from drying out during this process, these steps are performed in an atmosphere with controlled high humidity. Next, the cell, which has already been loaded with the samples, is assembled, and the capillaries for subsequent pressurization are connected on both sides. The detailed procedure of crystal loading into the HP cell and cell assembly is depicted in Fig. 1. After loading, the cell is installed on the goniometer of the beamline using a specially designed magnetic holder.
|
Figure 1
General procedure of an HP experiment with the cell. (a) Multiple protein crystals are transferred onto a pre-wetted Kapton support strip (1100 × 650 × 75 µm) in a stream of humidified air to prevent crystal dehydration. The application of protective oil (e.g. NVH oil) is recommended at this stage for dehydration-sensitive crystals. (b) The Kapton strip is inserted into the sapphire capillary, which already contains a small piece of wet paper tissue serving as a liquid reservoir at the opposite end. Following the Kapton strip, a second piece of paper tissue is inserted into the capillary from the same side, which is then immediately soaked with reservoir solution. (c) Subsequently, the capillary with the crystals is inserted into the central steel cage of the HP cell. The capillary with the Kapton strip can now be manually rotated to orient the crystals favorably with respect to the opening window of the cell and point towards the inline sample-viewing microscope when mounted later on the goniometer. Now, the cell assembly is completed and the screws are tightened. (d) The HP cell is attached to the goniometer of the beamline using a magnetic holder and the crystals are optically centered in the 26 keV X-ray beam. Prior to data collection, the cell is pressurized via nickel-clad fused-silica lines on both sides, which are connected to a double-stage air-driven helium compressor. |
The cell can then be pressurized with helium gas, which is applied through the two high-pressure capillaries connected to both ends of the sapphire capillaries. Helium gas was chosen as the pressurizing medium as it is supposed not to interact with protein crystals, it has a low absorption and scattering cross section for X-rays, and it does not undergo any phase transition in the chosen temperature and pressure range. To keep helium consumption for the experiments as low as possible and to ensure a high level of safety, the entire pressurized system was designed with a very small volume. In the event of an accident, therefore, only extremely small amounts of helium would be released with little kinetic energy, minimizing the impact on equipment and people.
For generating helium gas with pressures of up to 240 MPa we use a double-stage air-driven compressor station from Maximator GmbH. The compressor station automatically re-adjusts the preset helium pressure level in case of pressure loss due to potential leakages in the experimental setup. Two commercially available pressure sensors with calibrated digital output are installed at the compressor itself and next to the HP cell (BD sensors DMP and WIKA HP-2), allowing for continuous in situ pressure monitoring and logging of the setup status during the experiment. The applied pressure is freely adjustable between atmospheric pressure and 120 MPa with a precision of a few megapascals. A remotely controlled three-way air-actuated HP valve (VICI/VALCO) between the compressor and the HP cell allows controlled pressurization and decompression of the cell. All parts of the setup are connected via commercially available 1/32-inch UHPLC nickel-clad fused silica tubing with small inner diameters between 50 and 180 µm and by standard HP 1/4-inch steel tubing. Connections between different tubing types are accomplished via custom-made adapters (Maximator GmbH/VICI). A schematic drawing of the complete experimental setup is shown in Fig. S7.
2.2. Data collection and processing
All X-ray diffraction data were collected on the P11 beamline of the PETRA III storage ring at DESY in Hamburg (Burkhardt et al., 2016). Further details of the experimental setup are shown in Figs. S8 and S9. The standard graphical user interface of P11 was used, as in a conventional macromolecular crystallography experiment. Customized software limits for the goniometer were applied to avoid collisions of the HP cell with parts of the beamline, e.g. the collimator. The software environment allows for optical and X-ray-assisted crystal centering and an automated data processing pipeline via XDSAPP (Sparta et al., 2016), providing fast feedback on crystal quality, unit-cell constants and data completeness. Diffraction data were recorded at a photon energy of 26 keV to minimize sapphire absorption and with an X-ray beam size of 50 × 50 µm (FWHM, H×V) at the sample position on a Pilatus3 X 2M CdTe detector. Data were collected in 45° rotation wedges at each crystal position. To collect data at different pressures from the same crystal, crystals were exposed multiple times at different pressures, each at a new position. Radiation damage was avoided by dose estimation via the `expected crystal lifetime calculator' (https://bl831.als.lbl.gov/xtallife.html) and by applying an offset of at least 50 µm for multiple illuminations of the same crystal.
All data were manually reprocessed using XDS (Kabsch, 2010) and suitable data wedges were merged via XSCALE (Kabsch, 2010) to obtain complete data sets for each data point. No absorption correction was applied for the intensities (Ahsbahs, 2004). Possible shadowing of the diffraction images caused by metal parts of the HP cell was checked by manual inspection of the background images delivered by XDS and was accounted for during processing by background adaptation.
2.3. Protein crystallization
Trigonal crystals of ribonuclease A from Bos taurus (Sigma, R5500) were grown by the hanging drop vapor diffusion method as described previously by Zegers et al. (1994). Briefly, 10–20 mg ml−1 protein dissolved in 0.1 M sodium acetate pH 4.5 were mixed in a 1:1 ratio with precipitant containing 0.1 M sodium acetate pH 4.5, 1.2–1.5 M ammonium sulfate and 2–2.5 M sodium chloride, and equilibrated for one to two days at room temperature to obtain 200 µm sized crystals.
The human serine/threonine kinase 17b, also known as DRAK2, was purified and crystallized in batch in the presence of the inhibitor quercetin as described earler (Lieske et al., 2019). To obtain the DRAK2-ATP/ADP complex, the 50–75 µm sized batch-grown crystals were subsequently mixed in a 1:1 ratio with 100 mM ATP in DRAK2 crystallization buffer (0.1 M HEPES pH 6.5, 0.2 M ammonium acetate, 20% PEG 3350, 50 mM sodium/potassium tartrate, 50 mM magnesium chloride) and incubated for half an hour before they were used for HP diffraction experiments.
SARS-CoV-2 Mpro was purified and crystallized as described previously (Günther et al., 2021). Due to their 200 × 150 × 20 µm plate-like shape, Mpro crystals are prone to dehydration and hence were protected by application of NVH oil at the HP cell loading step.
Pedobacter heparinus N-acetylglucosamine 2-epimerase (AGE) was overexpressed in Escherichia coli and purified as described (Reich et al., 2022). Crystallization conditions for AGE were optimized based on the first screening hit, LMB Crystallization Screen (Molecular Dimensions) well G4. The best crystallization results were obtained at 12.6 mg ml−1 protein in 20 mM sodium phosphate buffer pH 7.5 mixed (4+2 µl) with 0.1 M sodium cacodylate buffer pH 5.0, 0.35 M sodium acetate and 26% PEG8000, leading to 70 × 400 × 700 µm plate-shaped crystals at room temperature after 5–7 days.
For purification of the F(M197)H mutant of the photosynthetic reaction center of the purple bacterium Cereibacter sphaeroides we used the protocol described previously (Fufina et al., 2007). Crystallization conditions were applied as described (Wöhri et al., 2009) with minor modifications. Batch crystallization was chosen instead of vapor diffusion to increase the number of grown crystals. RC solution (20–25 mg ml−1) was mixed with LSP in a 1:1 ratio. Around 20–30 µl of this mixture were placed into a sealed plastic tip and covered with an excess amount of 1 M trisodium citrate which acted as precipitant. Crystal growth took about one week at 21°C in the dark.
2.4. Structural analysis
For structure solution via molecular replacement with Phaser (McCoy et al., 2007), PDB entries 2e3w (Boerema et al., 2008), 6qf4 (Lieske et al., 2019), 2gz6 (Lee et al., 2007), 7ar5 (Günther et al., 2021) and 3v3y (Vasilieva et al., 2012) were used as templates for RNase A, DRAK2, AGE, Mpro and the RC, respectively. Structure solution was followed by iterative cycles of refinement in Phenix (Afonine et al., 2012; Liebschner et al., 2019) and manual model building in Coot (Emsley et al., 2010).
Crystal packing analysis, B-factor analysis and r.m.s.d. calculations were done with the CCP4 modules PISA, baverage and superpose (Potterton et al., 2003; Krissinel & Henrick, 2007, 2004). Pressure-induced intramolecular movements were estimated via Cα—Cα distance calculations and images were prepared using PyMOL (The PyMOL Molecular Graphics System, Version 1.8.4.0, Schrödinger LLC). Protein void volume analysis was done with the ProteinVolume 1.3 software using a volume probe radius of 0.02 Å and a surface probe minimum distance of 0.1 Å (Chen & Makhatadze, 2015). Difference distance matrices were calculated in Chimera (Chen et al., 2015) and their presentation optimized in Origin (OriginLab). Hinge movement analysis of DRAK2 domains was performed via the domain selection routine of the DynDom web server, which is designed to analyze concerted domain movements (Girdlestone & Hayward, 2016). DynDom domain rotations were calculated in PyMOL via the angle_between_domains plugin. For better comparison, hydrogen-bond networks for each structure were computed using Protoss (Bietz et al., 2014) and the Naomi library (Urbaczek et al., 2011) to determine the protonation states and hydrogen-bond interactions.
3. Results
3.1. HP structure determinations
We performed HP structure determinations of five different proteins: (i) ribonuclease A (RNase A) from Bos taurus, a well studied model protein previously used for HP studies up to 0.67 GPa (Kurpiewska et al., 2016), (ii) the Pedobacter heparinus AGE, one of two enzymes used for the two-stage industrial synthesis of sialic acid where pressure potentially increases reaction efficiency (Reich et al., 2022), (iii) the Cereibacter sphaeroides photosynthetic reaction center (RC) as a representative of membrane proteins, (iv) the human serine/threonine kinase 17B (DRAK2), a cancer-related pharmaceutically relevant target protein (Sanjo et al., 1998; Doherty et al., 2009; Edwards et al., 2015; Szoltysek et al., 2020), and (v) the SARS-CoV-2 Mpro, an essential cysteine protease of SARS-CoV-2 (Günther et al., 2021). Crystal structures were determined at pressures of up to 120 MPa, yielding maximum resolutions of 1.5 Å, 1.7 Å, 2.5 Å, 2.6 Å and 2.35 Å for RNase A, AGE, the F(M197)H mutant of the RC, DRAK2 and Mpro, respectively. Data collection and refinement statistics are provided in Tables S1–S4.
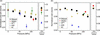
The unit-cell parameters of the crystals of all five proteins decrease with increasing pressure. The compression of the unit-cell volumes varies significantly between the investigated proteins. While Mpro crystals showed the smallest compression of only 0.15% at a pressure of 104 MPa compared with ambient conditions, the largest compression of the unit-cell volume by 2.8% was observed for AGE crystals already at 80 MPa. The unit-cell volumes of other protein crystals were compressed by 0.7% (RC, 100 MPa), 1.2% (RNaseA, 100 MPa) and 1.6% (DRAK2, 110 MPa) [Fig. 2(a)]. Upon pressure release, the unit-cell parameters of RNase A, DRAK2, Mpro and the RC returned to their initial values, whereas the AGE crystals did not fully revert. Generally, we see a trend towards stronger unit-cell compression with lower solvent content of the crystal, although this is not observed in the case of Mpro (Fig. S10).
|
Figure 2
Changes in (a) unit-cell volumes and (b) void volumes of the five studied proteins at different pressures. All values are normalized to the corresponding values at atmospheric pressure. The depicted unit-cell volumes are the normalized average volumes calculated from 2–19 individual crystals, with the error bars displaying the normalized mean of the estimated standard deviation of the unit-cell volume. Void volumes were calculated from the refined structures using ProteinVolume 1.3 (Chen & Makhatadze, 2015 ). Due to the incompleteness of the data sets, there are no void volume values for Mpro and AGE after pressure release. |
3.2. HP effects on protein structures
For all five studied proteins we did not observe significant changes in the overall three-dimensional folds upon pressurization. Generally, structural analysis shows that the atom displacements caused by approximately 100–120 MPa pressure are subtle and tend not to exceed 1 Å. However, as these changes involve not only individual residues but commonly whole regions ranging from secondary structure elements up to entire domains, we consider them to be significant.
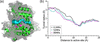
High pressure is able to deform and ultimately unfold protein structures. Mechanistically this process involves the collapse of small cavities, so-called solvent-excluded void volumes, inside the protein (Collins et al., 2011). Consistent with this, we observed a reduction in the void volumes for all five protein structures [Fig. 2(b)], with the void volume defined as the difference between the solvent-excluded volume and the invariable van der Waals volume of the protein (Chen & Makhatadze, 2015). Void volumes decreased by 0.7% for DRAK2, 1.2% for Mpro, 1.5% for RNase A, 1.8% for the RC and 5.0% for AGE at 80–110 MPa. Of all five studied proteins, AGE exhibits the least densely packed structure and hence has the largest potential for void volume compression – packing density being defined as the ratio of van der Waals volume to solvent-excluded volume. Additionally, we observed a reduction in the radii of the central tunnels of AGE, which consists of a dimer of two (α/α)6-barrels (Fig. 3).
|
Figure 3
Pressure effect on AGE from Pedobacter heparinus. AGE consists of a homodimer of two (α/α)6-barrels in a `front-to-front' configuration. (a) The cut through of one AGE monomer is shown in both the surface representation (gray) and the cartoon representation (green), allowing visualization of the shape of the central tunnel highlighted as blue spheres. Putative active site residues in close proximity (His244, His378, Glu314, Arg63, Glu247 and Arg381) are presented as pink sticks. (b) Parts of the central tunnel of the (α/α)6-barrel structure of AGE are compressed at 52 MPa (cyan line) and 80 MPa (pink line) compared with the atmospheric pressure structure (black line). |
3.3. Concerted pressure-induced movements correlate with protein architecture
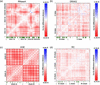
The observed pressure-induced atomic movements are structure-related, as they do not show a linear compression of the structure but contain information on pressure-induced shifts of domains or secondary structure elements and hence depend on the individual architecture of the studied protein. In this regard, RNase A and DRAK2 exhibit strong similarities because both enzymes are comprised of two domains divided by a large cleft containing the active site. Whereas the RNase A structure is very pressure-resistant and only showed minor changes, the difference distance matrices (DDMs) of DRAK2 comparing the HP and ambient-pressure structures reveal significant collective movements of adjacent residues [Fig. 4(b)]. The Cα—Cα difference distances within a domain (0.08–0.10 Å) are smaller on average than between different domains (0.21 Å). This phenomenon gives rise to the appearance of block patterns in the DDM that are characteristic for the domain structure of the respective protein. Overall, the observed changes are relatively small and in many cases fall within the coordinate uncertainty as reported by the refinement program (Lunin et al., 2002). Nevertheless, regions with movements above the combined uncertainty for the compared structures were identified for all proteins except RNaseA (Fig. S11).
|
Figure 4
Cα—Cα DDMs showing the pressure-induced compression of the structures. Shown are (a) RNaseA at 120 MPa, (b) DRAK2 at 110 MPa, (c) AGE at 80 MPa and (d) the RC at 120 MPa compared with the corresponding structures at atmospheric pressure. Domains are labeled for a better overview. Negative values indicate compression. Maximum compression values differ between protein systems. Maximum values for each system were used for individual color scale definition for clarity. Crystal contacts of the HP structures are indicated as green line patterns below the matrices. Indicated are all interfacing crystallography-related residues according to PISA (Krissinel & Henrick, 2007 ). |
Pedobacter heparinus AGE consists of a dimer of two (α/α)6-barrels in a `front-to front' configuration, as the PISA analysis clearly reveals. It does not contain domains that can swing in a hinge-like movement as is the case for DRAK2. The monomers were rather uniformly compressed and moved towards each other by approximately 0.5 Å at 80 MPa pressure, as estimated by the distance between their centers of mass. The dimer interface area was increased from 9.0% to 9.4%, and additionally most hydrogen bonds and salt-bridge interactions at the interface were shortened by 0.1–0.2 Å, ultimately leading to a strengthening of the dimer interface. Comparable with the results for DRAK2, the Cα—Cα DDM of AGE shows block patterns [Fig. 4(c)]. These patterns indicate that, at the applied pressure, the displacements of the monomers A and B towards each other were larger than the compression within each monomer. The structure of individual α-helices is clearly visible as a regular checked pattern in the DDM.
3.4. Pressure effects on a membrane protein
To the best of our knowledge, the Cereibacter sphaeroides photosynthetic reaction center (RC) is the first membrane protein structure studied at high pressure, although the stability of the hydrogen bonds of the special pair in the RC has been investigated under pressure using absorption spectroscopy (Kangur et al., 2017). The RC is a relatively large (∼100 kDa) transmembrane pigment–protein complex consisting of three polypeptide chains (L, H and M). It has no enzymatic activity but forms a scaffold for its ten non-covalently bound cofactors, i.e. four bacteriochlorophylls, two bacteriopheophytins, two quinones, one non-heme Fe2+ ion and one carotenoid molecule (Leonova et al., 2011). We observed that high pressure generally induces a reversible, subtle and uniform compression of the protein complex [Figs. S3(a) and S3(b)]. Nevertheless, we also observed concerted shifts of adjacent residues in the DDM of the RC, albeit on a smaller scale than for DRAK2 and much more complex due to the larger size of the protein [Fig. 4(d)]. The H chain is clearly divided into two subdomains (H10–130 and H131–249). The first subdomain consists of a long N-terminal helix and an ensemble of surface loops, whereas the second subdomain is a rather compact arrangement of β-strands and two helices situated on top of the central bundle of transmembrane helices.
In the active RC the electron transfer from the primary to the secondary quinone is associated with proton transport, and hence the conversion of light energy into chemical energy (Breton et al., 1994). The quinone at the QB site is weakly bound and leaves the RC after accepting two protons and two electrons, in this way functioning as an essential proton transporter in photosynthesis. In our structures, the ligand at this site is not the naturally occurring quinone but was exchanged with a monoolein due to the crystal preparation procedure (Selikhanov et al., 2020, 2022). However, both molecules share their long aliphatic tail and the monoolein is positioned in such a way as to interact with L-Ser223 and L-Asp213 as well, both being crucial residues responsible for the final proton transfer to the acceptor quinone.
At 120 MPa, the B factors of the RC were decreased on average by 8.4 Å2 for all protein atoms and by 12.5 Å2 for the atoms of the ten non-covalently bound cofactors, with the largest decrease of 25.5 Å2 observed for the monoolein molecule bound to the QB site [Fig. S3(c)]. As proven by the additional 2mFo–DFc electron density present for the monoolein molecule in the structures determined above 100 MPa, the long tail of this ligand is less delocalized at high pressure and two distinct conformations of the tail become more populated (Fig. S4). In addition to the B-factor decrease, this indicates a pressure-induced reduction in flexibility and hence stabilization of the ligand binding to the QB site.
3.5. Kinases – comparing pressure-induced movements with biological function
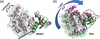
The largest pressure-induced structural changes of all five studied proteins were observed for the pharmaceutically relevant target proteins DRAK2 and Mpro. Analysis of the DRAK2 structures reveals that the domains separated by a wide cleft are closer to each other by 0.4 Å at 110 MPa, measured as the difference distance of the centers of mass of the individual domains. This is accompanied by a 0.8° rotation of the C-lobe towards the N-lobe, with the rotation axis situated close to the DRAK2 hinge region [Fig. 5(a)]. Regarding the direction, the pressure-induced movements observed for DRAK2 resemble the naturally occurring active site cleft closure found also in other kinases such as the cAMP-dependent protein kinase (PKA) [Fig. 5(b)], which plays a role in cell signaling processes and is used as a model system for this kind of serine/threonine protein kinases (Johnson et al., 2001). However, the compared DRAK2 structures belong to the same nucleotide state and the observed pressure-induced changes are on a much smaller scale than the movements observed for PKA upon ATP binding. The results show which movements are generally possible for DRAK2 in the crystalline context [Fig. 4(b)].
|
Figure 5
Domain movements in kinases. Comparison of (a) the pressure-induced domain movement of DRAK2 (by 0.8°) and (b) the domain movement observed upon ATP binding to the mammalian cAMP-dependent protein kinase A (PKA) (by 15.9°). Central cleft closure is observed upon ATP binding to PKA and – to a much smaller extent – upon pressure perturbation in DRAK2. The structures at atmospheric pressure and the corresponding nucleotide-free form are shown in green, whereas the 110 MPa structure and the ATP-bound state are colored pink. The structures are superimposed on their N-lobes (right-hand domains) and the C-lobes of the reference states are highlighted as light-gray surfaces. The rotation axes of the hinge movements as determined via the DynDom server (Girdlestone & Hayward, 2016 ) are represented as blue rods. PKA structures 1cmk (free form) and 1atp (ATP-bound form) (Zheng et al., 1993) were taken from the Protein Data Bank. |
3.6. Pressure-induced movements of SARS-CoV-2 Mpro
The protease Mpro, one of two viral cysteine proteases essential for the maturation of proteins involved in viral replication, is a major target for drug development against SARS-CoV-2 (Günther et al., 2021; Douangamath et al., 2020). Based on the high structural conservation of Mpro homologues among different pathogenic Betacoronaviruses (Zhang et al., 2020), our findings on the SARS-CoV-2 enzyme are assumed to be valuable for analyzing the structural dynamics of those closely related proteases as well. Mpro consists of a homodimer, with each monomer subdivided into the N-terminal domain I, the central domain II and, linked via the long flexible P5 loop, the α-helical C-terminal domain III. The active site pocket with the catalytic cysteine 145 is situated in a cleft between the N-terminal domain I and the central domain II.
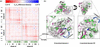
We solved the Mpro HP crystal structure at 104 MPa to 2.35 Å resolution and analyzed the pressure-induced movements compared with the structure at atmospheric pressure solved at 2.05 Å resolution. Upon structure superposition via rigid parts of the central β-sheet, we observed that high pressure induces slight rotations of both the N-terminal domain I by 1.1° and the C-terminal domain III by 0.6°. The movements in domain I involve, most importantly, the P2 helix with the adjacent loop next to the active site (45–54) by up to 0.52 Å (Leu50 Cα) and region 62–81 with a maximum Cα movement of 1.1 Å observed for the loop residue Asn72. In the Cα—Cα DDM these changes are clearly visible as one blue and one red stretch, respectively [Fig. 6(a)]. For both regions we hence confirm earlier findings describing them as flexible parts of Mpro (Pearce et al., 2017; Ebrahim et al., 2022). Notably, the P2 helix forms part of the active site pocket, and Met49 in particular was shown to play a major role in substrate binding and recognition (Muramatsu et al., 2016). The great plasticity around the active site, involving the P2 helix, the adjacent loop and the P5 loop, has also been observed during ligand binding and makes the design of specific Mpro inhibitors a challenging task (Kneller et al., 2020).
|
Figure 6
Pressure-induced movements in SARS-CoV-2 Mpro. (a) Cα—Cα DDM between the SARS-CoV-2 Mpro structures at atmospheric pressure and at 104 MPa. Crystal contacts of the HP structure are indicated as a green line pattern. One chain of the dimer contains 305 residues. Indicated are all crystallography-related interfacing residues according to PISA (Krissinel & Henrick, 2007 ). (b) Depiction of the observed rotation of the N-terminal domain (1.1°) and the C-terminal domain (0.6°) of Mpro at 104 MPa (pink) compared with atmospheric pressure (green). The structures are superimposed on the rigid parts of the central β-sheet at the dimer interface. |
The P5 loop, the linker region between domain II and III consisting of residues 190 to 198, does not change its overall conformation at high pressure but exhibits shifts of its backbone (up to 0.52 Å for Ala193 Cα). The temperature-dependent conformational heterogeneity between 100 K and 310 K previously described for the P5 loop involves lower flexibility at lower temperatures (Ebrahim et al., 2022). The main-chain atom B-factor analysis reveals that high pressure also reduces the P5 loop flexibility, as the B factors are on average reduced by 3.2 Å2 in residues 191–198 compared with a reduction of only 0.8 Å2 on average for the whole protein chain at high pressure. The rotation of domain III gives rise to a regular checked pattern in the DDM, indicating single α-helices [Fig. 6(a)]. The largest pressure-induced movements in domain III are observed for residues 221–228, but drawing conclusions for this region is difficult due to the weak electron density around residue Arg222. Additionally important to note is that residues 74 and 222 are neighbors in the crystal structure, and the corresponding regions hence do not move completely independently.
Concluding, our findings for the effect of high pressure on SARS-CoV-2 Mpro agree well with the results of crystallographic studies systematically investigating the temperature-dependent conformational space of Mpro at temperatures ranging from 100 K to 310 K (Pearce et al., 2017; Kneller et al., 2020; Ebrahim et al., 2022). These studies showed that Mpro exhibits a very high degree of flexibility in certain parts of the protein, including the P5 loop (residues 190–198), the P2 helix (residues 46–50), residues 68–76 of domain I, residues 92–97 of domain I and residues 218–227 of domain III. Thus, HP studies and studies at varying temperatures are complementary methods for investigating the local flexibility and conformational space of proteins.
4. Discussion
We have presented a new method for HP macromolecular crystallography experiments using helium gas as a pressurizing agent. Although helium is not supposed to interact with proteins and its solubility in water is rather low, data on the potential effects of helium on protein structures is scarce, to the best of our knowledge. Melnikov and co-workers reported that heavy noble gases affect the structure of membrane proteins by mimicking and altering protein–lipid interactions (Melnikov et al., 2022). In general, noble gases like helium can interact with hydrophobic surface areas of proteins via London dispersion forces, depending on the polarizability of the noble gas atoms (Quillin et al., 2000; Prangé et al., 2022). The polarizability, however, drops rapidly from heavier noble gases like xenon to lighter ones like helium (McNeill et al., 2020). Therefore, selecting helium as the inert pressurizing agent allowed us to minimize potential interactions with the macromolecules.
Technologically, the HP cell is unique, as multiple immobilized protein crystals on a Kapton support can be measured at several pressure points and also after pressure release. This design allows complete X-ray diffraction data sets to be collected from low-symmetry crystals, as demonstrated for the 200 × 150 × 20 µm plate-like crystals of Mpro (space group C2), which appears challenging to study using conventional DACs with randomly oriented single crystals. The applicable pressure range of up to 120 MPa corresponds well with the ambient pressure in the Challenger Deep, the deepest region of the Earth's oceans (10984 m), where life has been observed and is adapted to the environment (Todo et al., 2005; Du et al., 2021; Maguire et al., 2024).
This experimental design ensures the immobilization and deliberate orientation of the protein crystals inside the cell, provides low background scattering due to the used low-Z materials when exposed to X-ray radiation with a photon energy of 26 keV, and avoids all issues that possibly accompany experiments applying liquid pressure media such as dissolving protein crystals or movement of crystals during X-ray exposure (Ahsbahs, 2004; Zegers et al., 1994). The known position and orientation of the protein crystals on the Kapton support in the HP cell allow for rational sample-efficient collection of complete diffraction data sets at several pressure points, and even after pressure release, using exactly the same protein crystals in the same environment. We have demonstrated the general applicability of our method by determining the HP structures of five different proteins, including a membrane protein, at different pressures up to 120 MPa.
In agreement with previous studies, hydrostatic high pressure enables a controlled and subtle compression of the crystal volume along all axes, allowing one to alter or enrich the conformational states. The solvent is nearly incompressible and the observed compression of the unit cells is mainly allowed by a reduction in void volume. The level of unit-cell compressibility strongly depends on the individual protein. Previously, pressure-induced collective displacements of protein atoms by up to around 1 Å at several hundred megapascals have been reported (Urayama et al., 2002; Collins et al., 2007; Barstow et al., 2008). In a crystalline environment, crystal contacts can limit the protein's conformational flexibility, and at increased hydrostatic pressure surface side-chain orientations can potentially be altered. Crystal contact-dependent effects are however considered minor in comparison (Colloc'h et al., 2023).
Generally, for all five proteins we analyzed, the unit-cell volumes decreased with increasing pressure, although the compressibilities varied considerably between them. Whereas the unit-cell volume of Mpro was only compressed by 0.15% at 110 MPa, the compression of AGE was about 20 times larger, being 2.8% already at 80 MPa. On a structural basis, this effect can be explained by compression of the central tunnel and more importantly of the AGE dimer interface. AGE catalyzes the reversible epimerization between N-acetyl-D-mannosamine and N-acetyl-D-glucosamine, most probably via a deprotonation/reprotonation mechanism (Lee et al., 2007; Lloyd et al., 2021). In combination with an aldolase enzyme, AGE is used for biotechnological sialic acid synthesis. Due to the reduction in molar volume by the addition of a pyruvate molecule to N-acetyl-D-glucosamine to obtain sialic acid, this reaction is accelerated by higher pressures following Le Chatelier's principle. Reich and co-workers showed that the position of the equilibrium, the selectivity and the reaction yield of the conversion of N-acetylmannosamine and pyruvate into sialic acid were improved significantly when pressure was applied to a continuous-flow fixed-bed reactor with immobilized enzymes (Reich et al., 2022). However, the detailed reaction mechanism of AGE, the involved catalytic residues and the activity regulation via ATP-binding are still a matter of debate (Feng et al., 2020; Klermund et al., 2016; Lloyd et al., 2021). The lack of this information hinders the development and study of pressure-adapted AGE mutants and their application in HP biotechnology. Further experiments are necessary to verify whether the observed structural changes correlate with the functional properties of Pedobacter heparinus AGE.
For RNase A we observed the smallest structural changes, and indeed this protein has been shown to be very pressure-resistant, preserving its structure even at a pressure above 0.67 GPa (Kurpiewska et al., 2016). For the Cereibacter sphaeroides RC, to the best of our knowledge the first membrane protein studied with HP crystallography, the overall structural changes at 120 MPa are subtle as well. However, the ligand bound to the functionally relevant QB site was clearly stabilized by high pressure, highlighting the potential of HP experiments for a variety of ligand-binding studies. In a recent crystallographic study, Girard and co-workers showed that the binding of Zn2+-cyclen to a GTPase is strengthened at high pressure, driven by a pressure-dependent change of the preferred binding-site conformation (Girard et al., 2024).
By adding a new dimension to the explorable free-energy landscape, these experiments are well suited to studying protein flexibility and dynamics by complementing other techniques such as multi-temperature experiments. From the point of view of applying pressure as a process parameter in enzyme-dependent biotechnological applications, this opens up benefits and new optimization possibilities, for example with regard to enzyme turnover, product yield and selectivity (Reich et al., 2022; Eisenmenger & Reyes-De-Corcuera, 2009; Kumar et al., 2023; Khan, 2025).
For the two pharmaceutically important proteins, DRAK2 and SARS-CoV-2 Mpro, high pressure induces the largest structural rearrangements of the five studied proteins. Under pressure, the N- and C-lobes of DRAK2 move slightly towards each other, one small step on the trajectory of active-site cleft closure. The HP structure of Mpro clearly illustrates the structural flexibility around its active site. Knowledge of such conformational variability is essential for structure-based drug development, for the success of in silico compound screening methods, and as a basis for more accurate AI-assisted structure predictions including protein flexibility, thereby overcoming the single structure limit (Lane, 2023).
Supporting information
PDB references: RNase A at atmospheric pressure, 7q75; RNase A at 22 MPa, 7q76; RNase A at 50 MPa, 7q77; RNase A at 72 MPa, 7q78; RNase A at 100 MPa, 7q79; RNase A at 120 MPa, 7q7a; RNase A at atmospheric pressure after pressure release, 7q7b; DRAK2 at atmospheric pressure, 7q7c; DRAK2 at 110 MPa, 7q7d; DRAK2 at atmospheric pressure after pressure release, 7q7e; photosynthetic reaction center at atmospheric pressure, 7q7f; photosynthetic reaction center at 30 MPa, 7q7g; photosynthetic reaction center at 51 MPa, 7q7h; photosynthetic reaction center at 75 MPa, 7q7j; photosynthetic reaction center at 100 MPa, 7q7m; photosynthetic reaction center at 120 MPa, 7q7n; photosynthetic reaction center at atmospheric pressure after pressure release, 7q7o; N-acetylglucosamine 2-epimerase at atmospheric pressure, 8bry; N-acetylglucosamine 2-epimerase at 52 MPa, 8brz; N-acetylglucosamine 2-epimerase at 80 MPa, 8bs0; SARS-CoV-2 main protease at atmospheric pressure, 8bs1; SARS-CoV-2 main protease at 104 MPa, 8bs2
Additional figures and tables. DOI: https://doi.org/10.1107/S2052252526008468/min5004sup1.pdf
Acknowledgements
We acknowledge the Deutsches Elektronen-Synchrotron (DESY; Hamburg, Germany), a member of the Helmholtz Association HGF, for the provision of experimental facilities. All X-ray diffraction experiments of this research were carried out at PETRA III on beamline P11 in the years 2019 to 2021. Beamtime was allocated for proposals I-20181059, II-20190007 and I-20191472. This research was supported in part through the Maxwell computational resources operated at DESY. We thank Manfred Spiwek and Claudia Hagemann for their kind support in sapphire capillary grinding, and Mohamed H. Abdellatif for Kapton laser cutting. We additionally thank Tatiana Fufina and Lyudmila Vasilieva from the Federal Research Center Pushchino Scientific Center for Biological Research PSCBR (Moscow Region) for providing the RC protein.
Conflict of interest
The authors declare that they have no competing interests.
Data availability
All data are available in the main text or in the supplementary materials. All 22 determined protein structures have been deposited in the Protein Data Bank with the following PDB codes: 7q75 (RNase A at atmospheric pressure), 7q76 (RNase A at 22 MPa), 7q77 (RNase A at 50 MPa), 7q78 (RNase A at 72 MPa), 7q79 (RNase A at 100 MPa), 7q7a (RNase A at 120 MPa), 7q7b (RNase A at atmospheric pressure after pressure release), 7q7c (DRAK2 at atmospheric pressure), 7q7d (DRAK2 at 110 MPa), 7q7e (DRAK2 at atmospheric pressure after pressure release), 7q7f (photosynthetic reaction center at atmospheric pressure), 7q7g (photosynthetic reaction center at 30 MPa), 7q7h (photosynthetic reaction center at 51 MPa), 7q7j (photosynthetic reaction center at 75 MPa), 7q7m (photosynthetic reaction center at 100 MPa), 7q7n (photosynthetic reaction center at 120 MPa), 7q7o (photosynthetic reaction center at atmospheric pressure after pressure release), 8bry (N-acetylglucosamine 2-epimerase at atmospheric pressure), 8brz (N-acetylglucosamine 2-epimerase at 52 MPa), 8bs0 (N-acetylglucosamine 2-epimerase at 80 MPa), 8bs1 (SARS-CoV-2 main protease at atmospheric pressure) and 8bs2 (SARS-CoV-2 main protease at 104 MPa).
Funding information
This work was funded via the BMBF projects protP.S.I. (grant 031B0405A/B) and conSCIENCE (grant 16-GW0277). We additionally acknowledge funding by the Helmholtz Society via the projects FISCOV and SFragX, as well as the Helmholtz International Laboratory on Reliability, Repetition, Results at the most Advanced X-Ray Sources (HIR3X).
References
 Afonine, P. V., Albert, A., Diederichs, K., Hermoso, J. A., Krissinel, E., Márquez, J. A., Panjikar, S., Solà, M., Thorn, A. & Usón, I. (2025). Nat. Rev. Methods Primers 5, 64.
CrossRef
Google Scholar
Afonine, P. V., Grosse-Kunstleve, R. W., Echols, N., Headd, J. J., Moriarty, N. W., Mustyakimov, M., Terwilliger, T. C., Urzhumtsev, A., Zwart, P. H. & Adams, P. D. (2012). Acta Cryst. D68, 352–367.
Web of Science
CrossRef
CAS
IUCr Journals
Google Scholar
Ahsbahs, H. (2004). Z. Kristallogr. Cryst. Mater. 219, 305–308.
CrossRef
Google Scholar
Akasaka, K. (2025). Experimental Approaches of NMR Spectroscopy I: Methodology, pp. 1–35. Singapore: Springer Nature.
Google Scholar
Barstow, B., Ando, N., Kim, C. U. & Gruner, S. M. (2008). Proc. Natl Acad. Sci. USA 105, 13362–13366.
CrossRef
PubMed
Google Scholar
Berman, H., Henrick, K. & Nakamura, H. (2003). Nat. Struct. Mol. Biol. 10, 980–980.
Web of Science
CrossRef
CAS
Google Scholar
Bietz, S., Urbaczek, S., Schulz, B. & Rarey, M. (2014). J. Cheminform. 6, 12.
CrossRef
PubMed
Google Scholar
Boerema, D. J., Tereshko, V. A. & Kent, S. B. H. (2008). Biopolymers 90, 278–286.
CrossRef
PubMed
Google Scholar
Breton, J., Burie, J.-R., Berthomieu, C., Berger, G. & Nabedryk, E. (1994). Biochemistry 33, 4953–4965.
CrossRef
PubMed
Google Scholar
Burkhardt, A., Pakendorf, T., Reime, B., Meyer, J., Fischer, P., Stübe, N., Panneerselvam, S., Lorbeer, O., Stachnik, K., Warmer, M., Rödig, P., Göries, D. & Meents, A. (2016). Eur. Phys. J. Plus 131, 56.
Web of Science
CrossRef
Google Scholar
Burkhardt, A., Warmer, M., Panneerselvam, S., Wagner, A., Zouni, A., Glöckner, C., Reimer, R., Hohenberg, H. & Meents, A. (2012). Acta Cryst. F68, 495–500.
Web of Science
CrossRef
CAS
IUCr Journals
Google Scholar
Chen, C. R. & Makhatadze, G. I. (2015). BMC Bioinformatics 16, 101.
Google Scholar
Chen, J. E., Huang, C. C. & Ferrin, T. E. (2015). Bioinformatics 31, 1484–1486.
CrossRef
PubMed
Google Scholar
Collins, M. D., Kim, C. U. & Gruner, S. M. (2011). Annu. Rev. Biophys. 40, 81–98.
Web of Science
CrossRef
CAS
PubMed
Google Scholar
Collins, M. D., Quillin, M. L., Hummer, G., Matthews, B. W. & Gruner, S. M. (2007). J. Mol. Biol. 367, 752–763.
Web of Science
CrossRef
PubMed
CAS
Google Scholar
Colloc'h, N., Dhaussy, A.-C. & Girard, E. (2023). Methods in Enzymology, Vol. 688, Crystallography of Protein Dynamics, edited by N. Ando, pp. 349–381. Academic Press.
Google Scholar
Doherty, G. A., Byrne, S. M., Austin, S. C., Scully, G. M., Sadlier, D. M., Neilan, T. G., Kay, E. W., Murray, F. E. & Fitzgerald, D. J. (2009). Br. J. Cancer 101, 483–491.
CrossRef
PubMed
Google Scholar
Douangamath, A., Fearon, D., Gehrtz, P., Krojer, T., Lukacik, P., Owen, C. D., Resnick, E., Strain-Damerell, C., Aimon, A., Ábrányi-Balogh, P., Brandão-Neto, J., Carbery, A., Davison, G., Dias, A., Downes, T. D., Dunnett, L., Fairhead, M., Firth, J. D., Jones, S. P., Keeley, A., Keserü, G. M., Klein, H. F., Martin, M. P., Noble, M. E. M., O'Brien, P., Powell, A., Reddi, R. N., Skyner, R., Snee, M., Waring, M. J., Wild, C., London, N., von Delft, F. & Walsh, M. A. (2020). Nat. Commun. 11, 5047.
Web of Science
CrossRef
PubMed
Google Scholar
Du, M., Peng, X., Zhang, H., Ye, C., Dasgupta, S., Li, J., Li, J., Liu, S., Xu, H., Chen, C., Jing, H., Xu, H., Liu, J., He, S., He, L., Cai, S., Chen, S. & Ta, K. (2021). Innovation (Cambridge) 2, 100109.
Google Scholar
Ebrahim, A., Riley, B. T., Kumaran, D., Andi, B., Fuchs, M. R., McSweeney, S. & Keedy, D. A. (2022). IUCrJ 9, 682–694.
Web of Science
CrossRef
CAS
PubMed
IUCr Journals
Google Scholar
Edwards, B. A., Harris, T. L., Floersh, H., Lukens, J. R., Zaki, Md. H., Vogel, P., Kanneganti, T.-D., Bui, J. D. & McGargill, M. A. (2015). Int. Immunol. 27, 161–166.
CrossRef
PubMed
Google Scholar
Eisenmenger, M. J. & Reyes-De-Corcuera, J. I. (2009). Enzyme Microb. Technol. 45, 331–347.
Web of Science
CrossRef
CAS
Google Scholar
Emsley, P., Lohkamp, B., Scott, W. G. & Cowtan, K. (2010). Acta Cryst. D66, 486–501.
Web of Science
CrossRef
CAS
IUCr Journals
Google Scholar
Feng, Y., Lyu, X., Cong, Y., Hua, X., Sun, H., Wang, L., Yao, C. & Yang, R. (2020). Biochem. Eng. J. 161, 107662.
Web of Science
CrossRef
Google Scholar
Fischer, M., Shoichet, B. K. & Fraser, J. S. (2015). ChemBioChem 16, 1560–1564.
CrossRef
PubMed
Google Scholar
Fourme, R., Girard, E. & Akasaka, K. (2012). Curr. Opin. Struct. Biol. 22, 636–642.
Web of Science
CrossRef
CAS
PubMed
Google Scholar
Fufina, T. Y., Vasilieva, L. G., Khatypov, R. A., Shkuropatov, A. Y. & Shuvalov, V. A. (2007). FEBS Lett. 581, 5769–5773.
Web of Science
CrossRef
PubMed
CAS
Google Scholar
Girard, E., Lopes, P., Spoerner, M., Dhaussy, A.-C., Prangé, T., Kalbitzer, H. R. & Colloc'h, N. (2024). Chemistry 30, e202400304.
CrossRef
PubMed
Google Scholar
Girdlestone, C. & Hayward, S. (2016). J. Comput. Biol. 23, 21–26.
Web of Science
CrossRef
CAS
PubMed
Google Scholar
Grasset, O. (2001). High Pressure Res. 21, 139–157.
CrossRef
Google Scholar
Günther, S., Reinke, P. Y. A., Fernández-García, Y., Lieske, J., Lane, T. J., Ginn, H. M., Koua, F. H. M., Ehrt, C., Ewert, W., Oberthuer, D., Yefanov, O., Meier, S., Lorenzen, K., Krichel, B., Kopicki, J.-D., Gelisio, L., Brehm, W., Dunkel, I., Seychell, B., Gieseler, H., Norton-Baker, B., Escudero-Pérez, B., Domaracky, M., Saouane, S., Tolstikova, A., White, T. A., Hänle, A., Groessler, M., Fleckenstein, H., Trost, F., Galchenkova, M., Gevorkov, Y., Li, C., Awel, S., Peck, A., Barthelmess, M., Schlünzen, F., Lourdu Xavier, P., Werner, N., Andaleeb, H., Ullah, N., Falke, S., Srinivasan, V., França, B. A., Schwinzer, M., Brognaro, H., Rogers, C., Melo, D., Zaitseva-Kinneberg, J. I., Knoska, J., Peña-Murillo, G. E., Mashhour, A. R., Hennicke, V., Fischer, P., Hakanpää, J., Meyer, J., Gribbon, P., Ellinger, B., Kuzikov, M., Wolf, M., Beccari, A. R., Bourenkov, G., von Stetten, D., Pompidor, G., Bento, I., Panneerselvam, S., Karpics, I., Schneider, T. R., Garcia-Alai, M. M., Niebling, S., Günther, C., Schmidt, C., Schubert, R., Han, H., Boger, J., Monteiro, D. C. F., Zhang, L., Sun, X., Pletzer-Zelgert, J., Wollenhaupt, J., Feiler, C. G., Weiss, M. S., Schulz, E.-C., Mehrabi, P., Karničar, K., Usenik, A., Loboda, J., Tidow, H., Chari, A., Hilgenfeld, R., Uetrecht, C., Cox, R., Zaliani, A., Beck, T., Rarey, M., Günther, S., Turk, D., Hinrichs, W., Chapman, H. N., Pearson, A. R., Betzel, C. & Meents, A. (2021). Science 372, 642–646.
Web of Science
PubMed
Google Scholar
Johnson, D. A., Akamine, P., Radzio-Andzelm, E., Madhusudan, M. & Taylor, S. S. (2001). Chem. Rev. 101, 2243–2270.
CrossRef
PubMed
CAS
Google Scholar
Kabsch, W. (2010). Acta Cryst. D66, 125–132.
Web of Science
CrossRef
CAS
IUCr Journals
Google Scholar
Kangur, L., Jones, M. R. & Freiberg, A. (2017). Biophys. Chem. 231, 27–33.
Web of Science
CrossRef
CAS
PubMed
Google Scholar
Keedy, D. A., Kenner, L. R., Warkentin, M., Woldeyes, R. A., Hopkins, J. B., Thompson, M. C., Brewster, A. S., Van Benschoten, A. H., Baxter, E. L., Uervirojnangkoorn, M., McPhillips, S. E., Song, J., Alonso-Mori, R., Holton, J. M., Weis, W. I., Brunger, A. T., Soltis, S. M., Lemke, H., Gonzalez, A., Sauter, N. K., Cohen, A. E., van den Bedem, H., Thorne, R. E. & Fraser, J. S. (2015). eLife 4, e07574.
Web of Science
CrossRef
PubMed
Google Scholar
Khan, M. F. (2025). World J. Microbiol. Biotechnol. 41, 362.
CrossRef
PubMed
Google Scholar
Kim, C. U., Kapfer, R. & Gruner, S. M. (2005). Acta Cryst. D61, 881–890.
Web of Science
CrossRef
CAS
IUCr Journals
Google Scholar
Klermund, L., Riederer, A., Hunger, A. & Castiglione, K. (2016). Enzyme Microb. Technol. 87–88, 70–78.
CrossRef
CAS
PubMed
Google Scholar
Kneller, D. W., Phillips, G., O'Neill, H. M., Jedrzejczak, R., Stols, L., Langan, P., Joachimiak, A., Coates, L. & Kovalevsky, A. (2020). Nat. Commun. 11, 3202.
Web of Science
CrossRef
PubMed
Google Scholar
Krissinel, E. & Henrick, K. (2004). Acta Cryst. D60, 2256–2268.
Web of Science
CrossRef
CAS
IUCr Journals
Google Scholar
Krissinel, E. & Henrick, K. (2007). J. Mol. Biol. 372, 774–797.
Web of Science
CrossRef
PubMed
CAS
Google Scholar
Kumar, P., Kermanshahi-Pour, A., Brar, S. K., He, Q. S. & Rainey, J. K. (2023). Biotechnol. Adv. 68, 108219.
CrossRef
PubMed
Google Scholar
Kurpiewska, K., Dziubek, K., Katrusiak, A., Font, J., Ribò, M., Vilanova, M. & Lewiński, K. (2016). Chem. Phys. 468, 53–62.
Web of Science
CrossRef
CAS
Google Scholar
Kurpiewska, K., Sławek, J., Klonecka, A. & Kozak, M. (2023). Crystals 13, 560.
CrossRef
Google Scholar
Lane, T. J. (2023). Nat. Methods 20, 170–173.
CrossRef
CAS
PubMed
Google Scholar
Lee, Y.-C., Wu, H.-M., Chang, Y.-N., Wang, W.-C. & Hsu, W.-H. (2007). J. Mol. Biol. 367, 895–908.
Web of Science
CrossRef
PubMed
CAS
Google Scholar
Leonova, M. M., Fufina, T. Yu., Vasilieva, L. G. & Shuvalov, V. A. (2011). Biochem. Moscow 76, 1465–1483.
CrossRef
CAS
Google Scholar
Liebschner, D., Afonine, P. V., Baker, M. L., Bunkóczi, G., Chen, V. B., Croll, T. I., Hintze, B., Hung, L.-W., Jain, S., McCoy, A. J., Moriarty, N. W., Oeffner, R. D., Poon, B. K., Prisant, M. G., Read, R. J., Richardson, J. S., Richardson, D. C., Sammito, M. D., Sobolev, O. V., Stockwell, D. H., Terwilliger, T. C., Urzhumtsev, A. G., Videau, L. L., Williams, C. J. & Adams, P. D. (2019). Acta Cryst. D75, 861–877.
Web of Science
CrossRef
IUCr Journals
Google Scholar
Lieske, J., Cerv, M., Kreida, S., Komadina, D., Fischer, J., Barthelmess, M., Fischer, P., Pakendorf, T., Yefanov, O., Mariani, V., Seine, T., Ross, B. H., Crosas, E., Lorbeer, O., Burkhardt, A., Lane, T. J., Guenther, S., Bergtholdt, J., Schoen, S., Törnroth-Horsefield, S., Chapman, H. N. & Meents, A. (2019). IUCrJ 6, 714–728.
Web of Science
CrossRef
CAS
PubMed
IUCr Journals
Google Scholar
Lloyd, M. D., Yevglevskis, M., Nathubhai, A., James, T. D., Threadgill, M. D. & Woodman, T. J. (2021). Chem. Soc. Rev. 50, 5952–5984.
CrossRef
CAS
PubMed
Google Scholar
Lunin, V. Y., Afonine, P. V. & Urzhumtsev, A. G. (2002). Acta Cryst. A58, 270–282.
Web of Science
CrossRef
CAS
IUCr Journals
Google Scholar
Maguire, S. H., Mercer, S. R. & Wiebe, H. A. (2024). J. Phys. Chem. B 128, 10604–10614.
CrossRef
CAS
PubMed
Google Scholar
McCoy, A. J., Grosse-Kunstleve, R. W., Adams, P. D., Winn, M. D., Storoni, L. C. & Read, R. J. (2007). J. Appl. Cryst. 40, 658–674.
Web of Science
CrossRef
CAS
IUCr Journals
Google Scholar
McNeill, A. S., Peterson, K. A. & Dixon, D. A. (2020). J. Chem. Phys. 153, 174304.
CrossRef
PubMed
Google Scholar
Melnikov, I., Orekhov, P., Rulev, M., Kovalev, K., Astashkin, R., Bratanov, D., Ryzhykau, Y., Balandin, T., Bukhdruker, S., Okhrimenko, I., Borshchevskiy, V., Bourenkov, G., Mueller-Dieckmann, C., van der Linden, P., Carpentier, P., Leonard, G., Gordeliy, V. & Popov, A. (2022). Commun. Biol. 5, 360.
Web of Science
CrossRef
PubMed
Google Scholar
Muramatsu, T., Takemoto, C., Kim, Y.-T., Wang, H., Nishii, W., Terada, T., Shirouzu, M. & Yokoyama, S. (2016). Proc. Natl Acad. Sci. USA 113, 12997–13002.
CrossRef
CAS
PubMed
Google Scholar
Pattni, V. & Heyden, M. (2019). J. Phys. Chem. B 123, 6014–6022.
CrossRef
CAS
PubMed
Google Scholar
Pearce, N. M., Krojer, T., Bradley, A. R., Collins, P., Nowak, R. P., Talon, R., Marsden, B. D., Kelm, S., Shi, J., Deane, C. M. & von Delft, F. (2017). Nat. Commun. 8, 15123.
Web of Science
CrossRef
PubMed
Google Scholar
Potterton, E., Briggs, P., Turkenburg, M. & Dodson, E. (2003). Acta Cryst. D59, 1131–1137.
Web of Science
CrossRef
CAS
IUCr Journals
Google Scholar
Prangé, T., Carpentier, P., Dhaussy, A.-C., van der Linden, P., Girard, E. & Colloc'h, N. (2022). Acta Cryst. D78, 162–173.
Web of Science
CrossRef
IUCr Journals
Google Scholar
Quillin, M. L., Breyer, W. A., Griswold, I. J. & Matthews, B. W. (2000). J. Mol. Biol. 302, 955–977.
Web of Science
CrossRef
PubMed
CAS
Google Scholar
Ragan, D. D., Gustavsen, R. & Schiferl, D. (1992). J. Appl. Phys. 72, 5539–5544.
CrossRef
CAS
Web of Science
Google Scholar
Reich, J. A., Aßmann, M., Hölting, K., Bubenheim, P., Kuballa, J. & Liese, A. (2022). Beilstein J. Org. Chem. 18, 567–579.
CrossRef
CAS
PubMed
Google Scholar
Rhodes, G. (2006). Crystallography Made Crystal Clear. Amsterdam: Elsevier.
Google Scholar
Sanjo, H., Kawai, T. & Akira, S. (1998). J. Biol. Chem. 273, 29066–29071.
Web of Science
CrossRef
CAS
PubMed
Google Scholar
Selikhanov, G., Fufina, T., Guenther, S., Meents, A., Gabdulkhakov, A. & Vasilieva, L. (2022). IUCrJ 9, 261–271.
CrossRef
CAS
PubMed
IUCr Journals
Google Scholar
Selikhanov, G., Fufina, T., Vasilieva, L., Betzel, C. & Gabdulkhakov, A. (2020). IUCrJ 7, 1084–1091.
CrossRef
CAS
PubMed
IUCr Journals
Google Scholar
Sieg, J., Sandmeier, C. C., Lieske, J., Meents, A., Lemmen, C., Streit, W. R. & Rarey, M. (2022). Proteins 90, 1521–1537.
CrossRef
CAS
PubMed
Google Scholar
Sparta, K. M., Krug, M., Heinemann, U., Mueller, U. & Weiss, M. S. (2016). J. Appl. Cryst. 49, 1085–1092.
Web of Science
CrossRef
CAS
IUCr Journals
Google Scholar
Stachowski, T. R. & Fischer, M. (2026). Nat. Chem. Biol. 22, 169–179.
Web of Science
CrossRef
CAS
PubMed
Google Scholar
Szoltysek, K., Ciardullo, C., Zhou, P., Walaszczyk, A., Willmore, E., Rand, V., Marshall, S., Hall, A. J., Harrison, C., Eswaran, J. & Soundararajan, M. (2020). Int. J. Mol. Sci. 21, 7663.
CrossRef
PubMed
Google Scholar
Todo, Y., Kitazato, H., Hashimoto, J. & Gooday, A. J. (2005). Science 307, 689.
CrossRef
PubMed
Google Scholar
Urayama, P., Phillips, G. N. & Gruner, S. M. (2002). Structure 10, 51–60.
CrossRef
PubMed
CAS
Google Scholar
Urbaczek, S., Kolodzik, A., Fischer, J. R., Lippert, T., Heuser, S., Groth, I., Schulz-Gasch, T. & Rarey, M. (2011). J. Chem. Inf. Model. 51, 3199–3207.
Web of Science
CrossRef
CAS
PubMed
Google Scholar
Vasilieva, L. G., Fufina, T. Y., Gabdulkhakov, A. G., Leonova, M. M., Khatypov, R. A. & Shuvalov, V. A. (2012). Biochim. Biophys. Acta 1817, 1407–1417.
CrossRef
CAS
PubMed
Google Scholar
Winter, R. (2019). Annu. Rev. Biophys. 48, 441–463.
Web of Science
CrossRef
CAS
PubMed
Google Scholar
Winter, R. & Dzwolak, W. (2004). Philos. Trans. A 363, 537–563.
Google Scholar
Wöhri, A. B., Wahlgren, W. Y., Malmerberg, E., Johansson, L. C., Neutze, R. & Katona, G. (2009). Biochemistry 48, 9831–9838.
PubMed
Google Scholar
Yamamoto, K. (2017). Biosci. Biotechnol. Biochem. 81, 672–679.
CrossRef
CAS
PubMed
Google Scholar
Zegers, I., Maes, D., Dao-Thi, M., Wyns, L., Poortmans, F. & Palmer, R. (1994). Protein Sci. 3, 2322–2339.
CrossRef
CAS
PubMed
Google Scholar
Zhang, L., Lin, D., Sun, X., Curth, U., Drosten, C., Sauerhering, L., Becker, S., Rox, K. & Hilgenfeld, R. (2020). Science 368, 409–412.
CrossRef
CAS
PubMed
Google Scholar
Zheng, J., Knighton, D. R., Xuong, N. H., Taylor, S. S., Sowadski, J. M. & Ten Eyck, L. F. (1993). Protein Sci. 2, 1559–1573.
CrossRef
PubMed
Web of Science
Google Scholar
This is an open-access article distributed under the terms of the Creative Commons Attribution (CC-BY) Licence, which permits unrestricted use, distribution, and reproduction in any medium, provided the original authors and source are cited.
access